The traceability matrix allows you visualise the dependencies between  requirements,
  change requests,
  test cases and other other assets in your
  project.
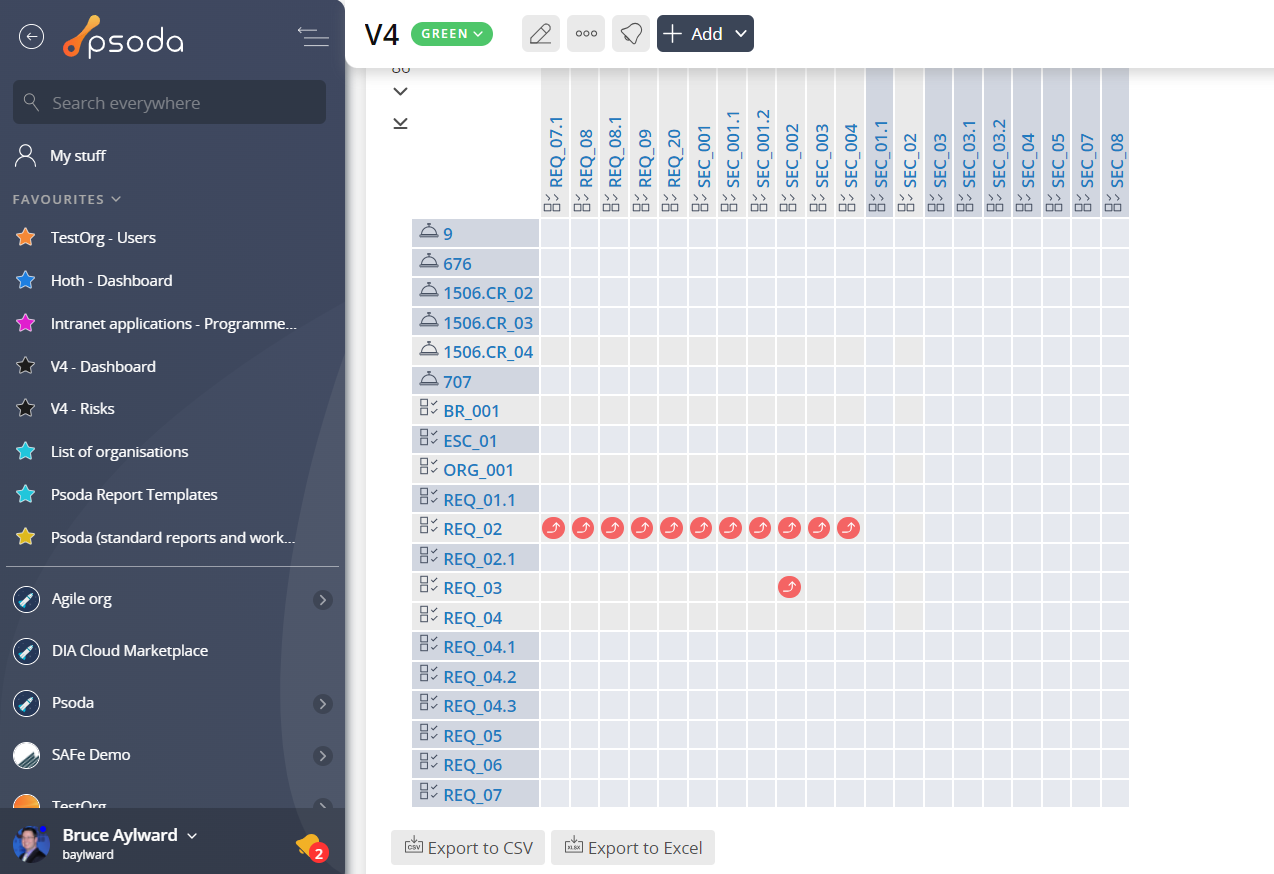
 The image on the right shows an example of a traceability matrix. The first column and the first row shows a change request (86) and a list of requirements. The arrows shows the dependencies between two items.
For example, the intersection between SEC_01 in the second row and SEC_01.1 in the second column shows a green arrow indicating that requirement SEC_01.1 is dependent on SEC_01.
To add a new dependency you can just click on an empty cell. You cannot created a looping dependency so some cells will be inactive. For example say you had three requirements A, B and C. Say you’ve added a dependency from A to B and also from B to C, then you cannot add a dependency from C to A.
The image on the right shows an example of a traceability matrix. The first column and the first row shows a change request (86) and a list of requirements. The arrows shows the dependencies between two items.
For example, the intersection between SEC_01 in the second row and SEC_01.1 in the second column shows a green arrow indicating that requirement SEC_01.1 is dependent on SEC_01.
To add a new dependency you can just click on an empty cell. You cannot created a looping dependency so some cells will be inactive. For example say you had three requirements A, B and C. Say you’ve added a dependency from A to B and also from B to C, then you cannot add a dependency from C to A.
 CSV or
  Excel. These exports will include the whole matrix, regardless of the number of columns and rows you’ve set in the display options (see below).
 risks,
  issues,
  features, change requests, requirements and test cases. You can also set the maximum number of columns and rows to display. Click on the “Update matrix” button to update the traceability matrix once you’ve changed the display options.
 The image on the right shows an example of a traceability matrix. The first column and the first row shows a change request (86) and a list of requirements. The arrows shows the dependencies between two items.
For example, the intersection between SEC_01 in the second row and SEC_01.1 in the second column shows a green arrow indicating that requirement SEC_01.1 is dependent on SEC_01.
To add a new dependency you can just click on an empty cell. You cannot created a looping dependency so some cells will be inactive. For example say you had three requirements A, B and C. Say you’ve added a dependency from A to B and also from B to C, then you cannot add a dependency from C to A.
The image on the right shows an example of a traceability matrix. The first column and the first row shows a change request (86) and a list of requirements. The arrows shows the dependencies between two items.
For example, the intersection between SEC_01 in the second row and SEC_01.1 in the second column shows a green arrow indicating that requirement SEC_01.1 is dependent on SEC_01.
To add a new dependency you can just click on an empty cell. You cannot created a looping dependency so some cells will be inactive. For example say you had three requirements A, B and C. Say you’ve added a dependency from A to B and also from B to C, then you cannot add a dependency from C to A.