Once you have entered your  tasks &
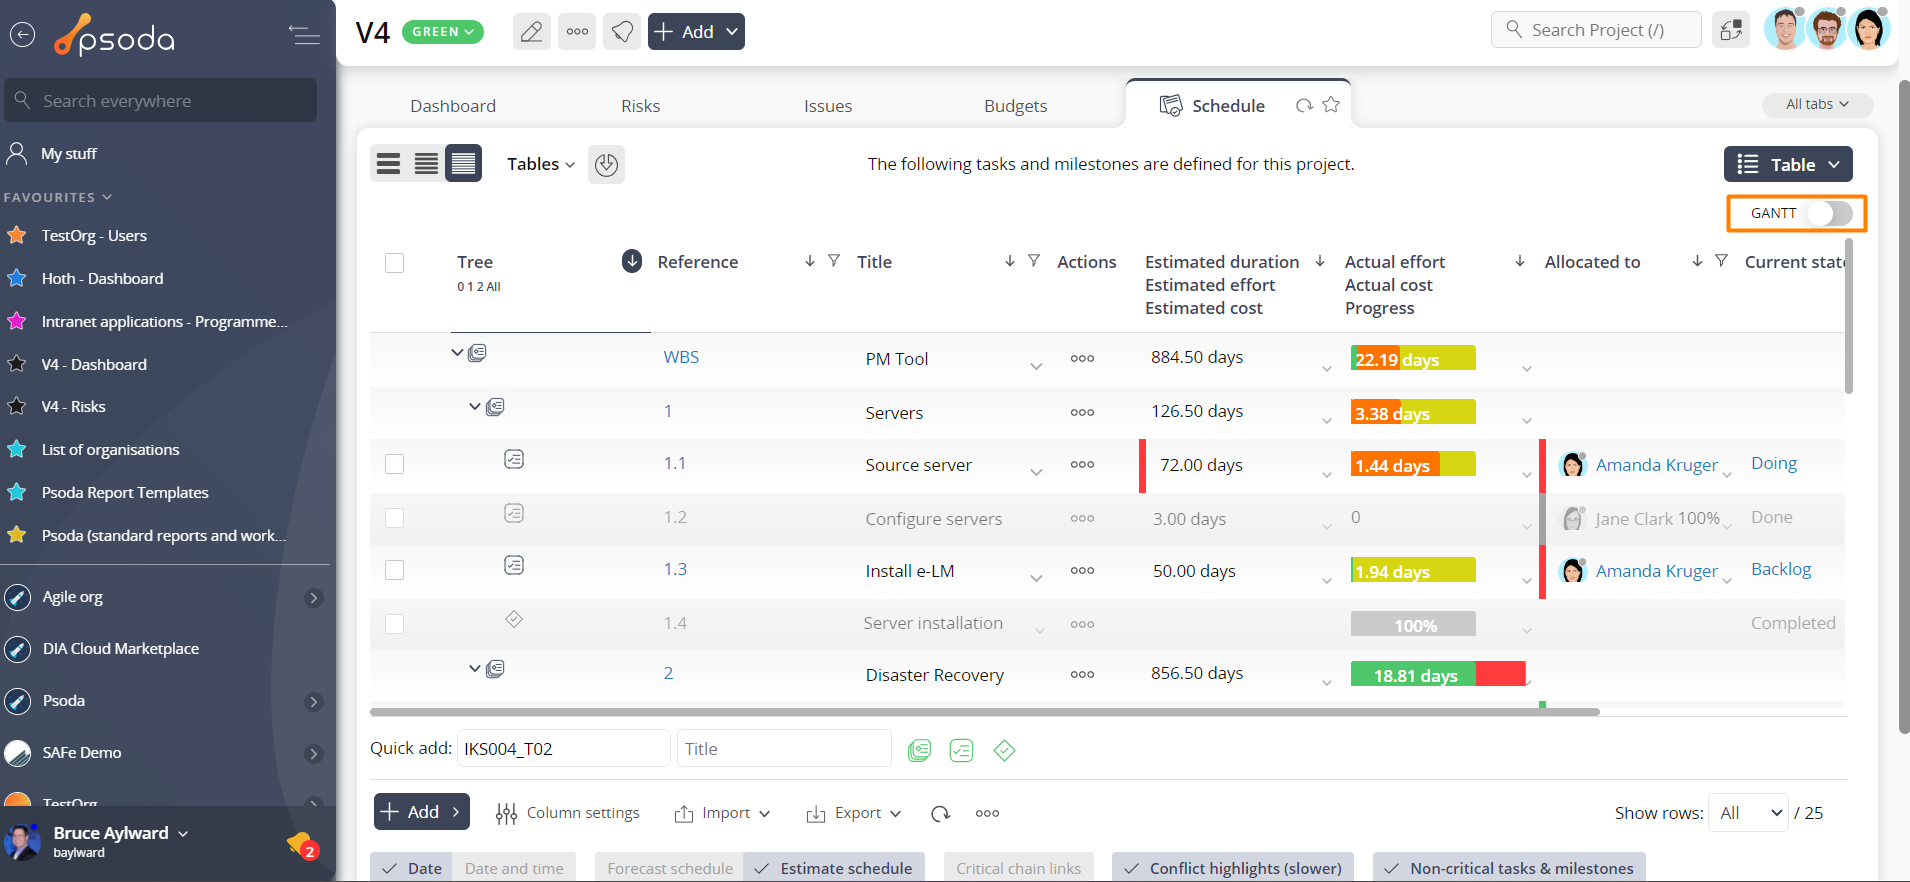
  milestones into Psoda, you can view them on a GANTT chart. To do this either select GANTT from the list of views or click the GANTT toggle, see Figure 1 below.


If you are on the GANTT sub view (not pictured), you can change the way the GANTT chart looks by selecting the options below the GANTT chart. The GANTT chart is static and cannot be edited inline. You can however, copy it to allow pasting into documents. To copy the GANTT chart right click and select copy image.

Figure 1 – View of GANTT tab in Other Views drop-down
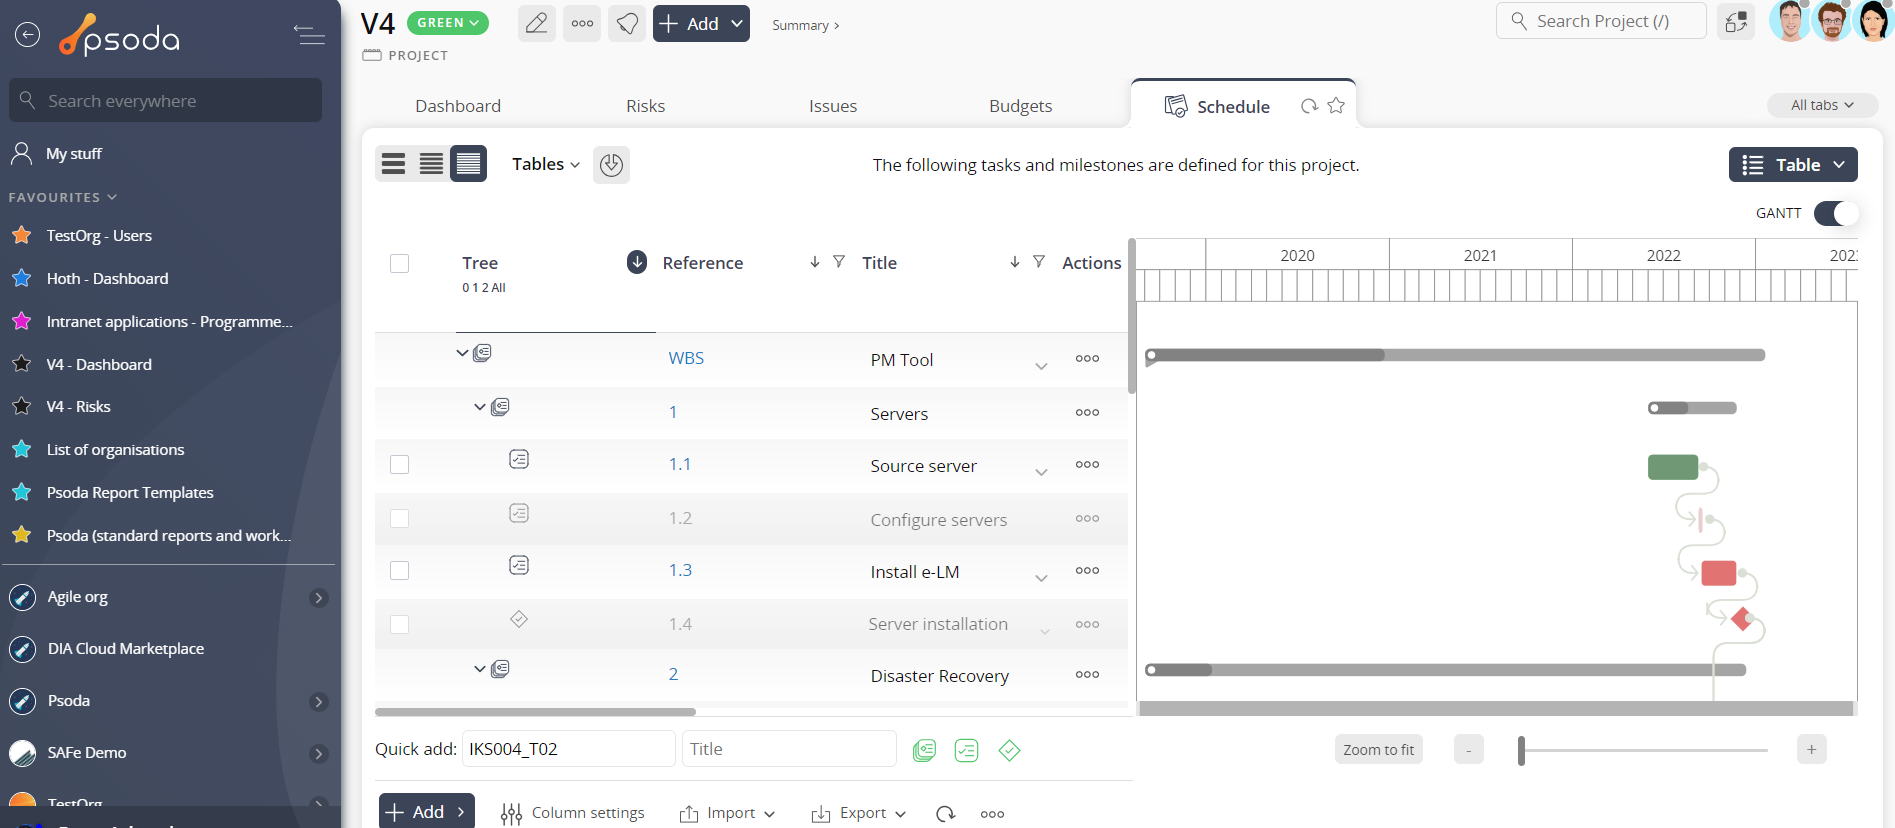
Once selected, you will be able to see all of the entered assets on a GANTT chart similar to the view shown in Figure 2 below.
Figure 2 – GANTT view
If you have toggled the GANTT (as above), you can interact with the chart by dragging and dropping bars to change dates etc. You can zoom and scroll using the controls underneath.If you are on the GANTT sub view (not pictured), you can change the way the GANTT chart looks by selecting the options below the GANTT chart. The GANTT chart is static and cannot be edited inline. You can however, copy it to allow pasting into documents. To copy the GANTT chart right click and select copy image.