The dependency matrix visually shows the dependencies between programmes, from programmes to projects and between projects.
The dependency matrix is available on the  programme and the
  organisation view pages. On the view programme page the dependency matrix will show all of the sub-programmes and all of the projects for the selected programme. On the view organisation page the dependency matrix will include all of the programmes and projects for that organisation.
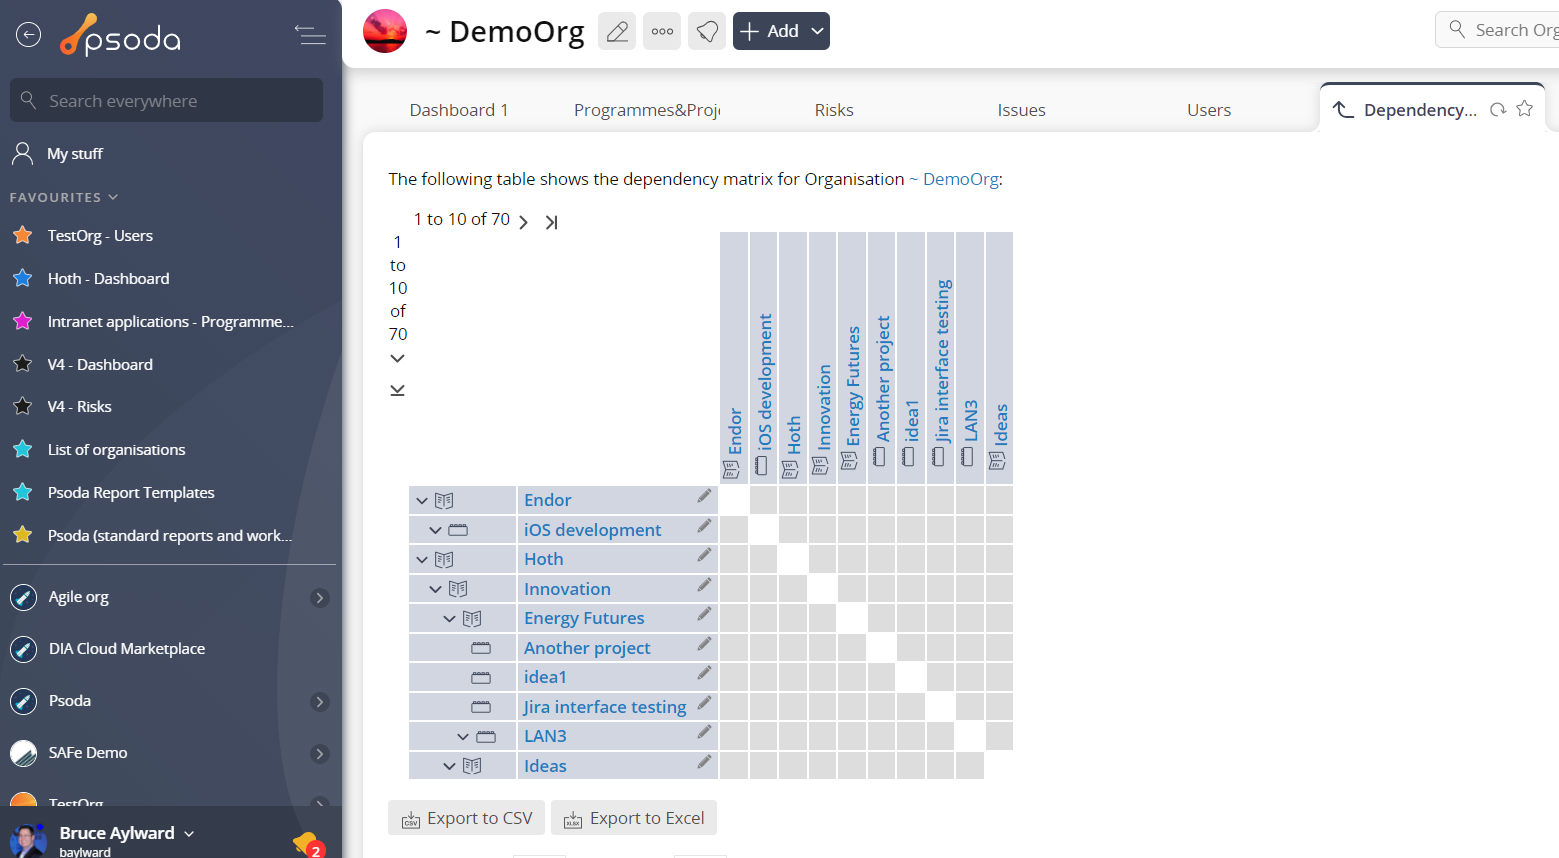
Figure 1 below shows an example of a dependency matrix at the organisation veiw page.
 pencil icon at the column’s programme or project name, you can mark changes to that programme or project. The intersection of a column and a row represents the dependency from the programme or project in the row to the programme or project in the column, i.e. from the left to the top.


Figure 1 – Dependency matrix
Columns and rows
The matrix shows a list of programmes and project down the left-hand side and across the top. If you select theMatrix cells
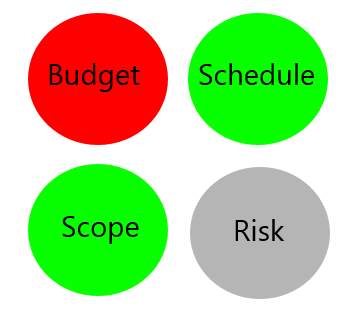
If there is no dependency between a particular row and column then the intersection will be blank. You can click on the blank cell to add a new dependency for that particular row and column. If a dependency has been defined previously for a particular row and column then the intersecting cell will show a 2×2 traffic light and a number representing the percentage of impact changes to the row will have on that column. If you click on the cell you will be able to edit that particular dependency. The diagonal is greyed out as these entries would represent the dependencies of programmes or projects onto themselves.Traffic lights
The traffic light represents the change flags for that dependency, i.e. which of the four impact areas have changed:
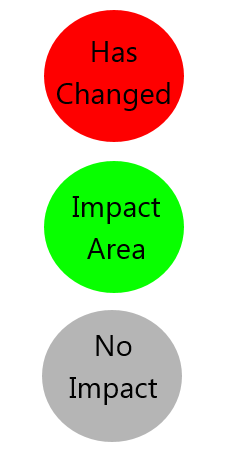
Colours
The colours in the traffic light represents:
