Key feature
Dashboards
View information exactly the way you desire
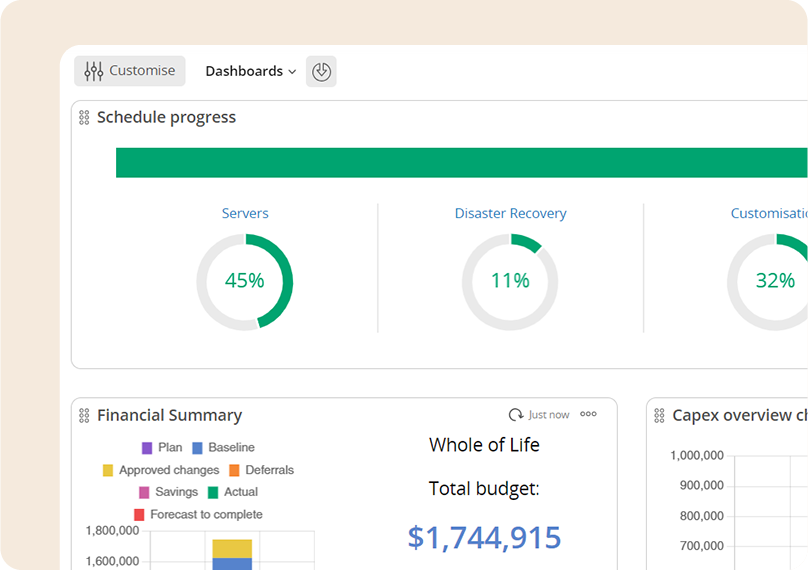
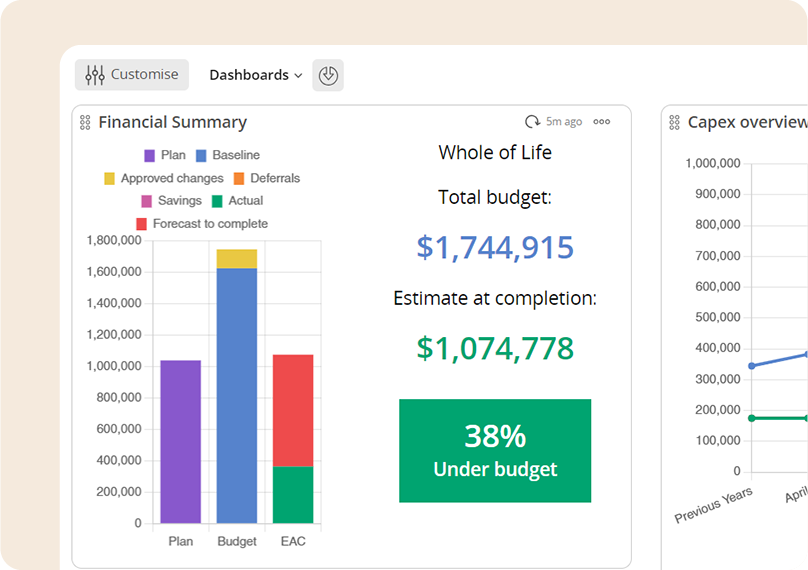
Personalise your dashboards with ease, select the key performance indicators, graphs and visualisations that align perfectly with your goals.


Shape your data
Ignite your data-driven insights with fully customisable dashboards. Say goodbye to one-size-fits-all solutions and embrace a world of endless possibilities for change and customisation.
Our cutting-edge platform puts you in control, allowing you to shape your data experience according to your unique needs and preferences.
Our cutting-edge platform puts you in control, allowing you to shape your data experience according to your unique needs and preferences.
Personalise your dashboards
Saved dashboards
Imagine spending valuable time crafting the perfect dashboard in Psoda, only to have your stakeholders request a separate dashboard solely focused on risks. Instead of discarding your hard work and starting from scratch, Psoda offers a simple solution - saved dashboards. With just a few clicks you can save your meticulously designed dashboard under a unique name and reload it whenever you need it. No more wasted efforts or rebuilding from the ground up. Plus, you can easily share your incredible dashboards with your team members.
Custom dashlets
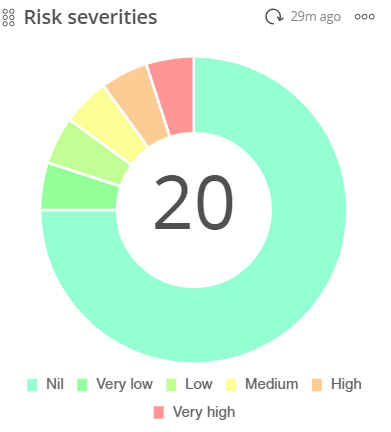
Psoda understands that one size doesn't always fit all. That's why we provide over 130 ready-to-use dashlets right out of the box, offering you a wide range of choices. However, we also recognise that you may have specific requirements or a unique vision for your project. With Psoda's built-in report engine, you can create custom dashlets tailored to your needs.
Our custom dashlets let you to go beyond the basics. Whether you want to incorporate informative text, dynamic tables, visually captivating GANTT charts, interactive graphs or even data-driven diagrams, Psoda has got you covered. You can design and display the precise information that matters most to your project.
Our custom dashlets let you to go beyond the basics. Whether you want to incorporate informative text, dynamic tables, visually captivating GANTT charts, interactive graphs or even data-driven diagrams, Psoda has got you covered. You can design and display the precise information that matters most to your project.
A real-time canvas
Psoda’s customisable dashboards provide the perfect canvas to transform raw data into actionable intelligence:
Gain a deeper understanding of your operations
Spot emerging trends
Make informed decisions
See which initiatives are contributing to organisational goals
Identify underperforming projects

Learn more about dashboards
Let us show you what you want to see with a free, personalised demo.

