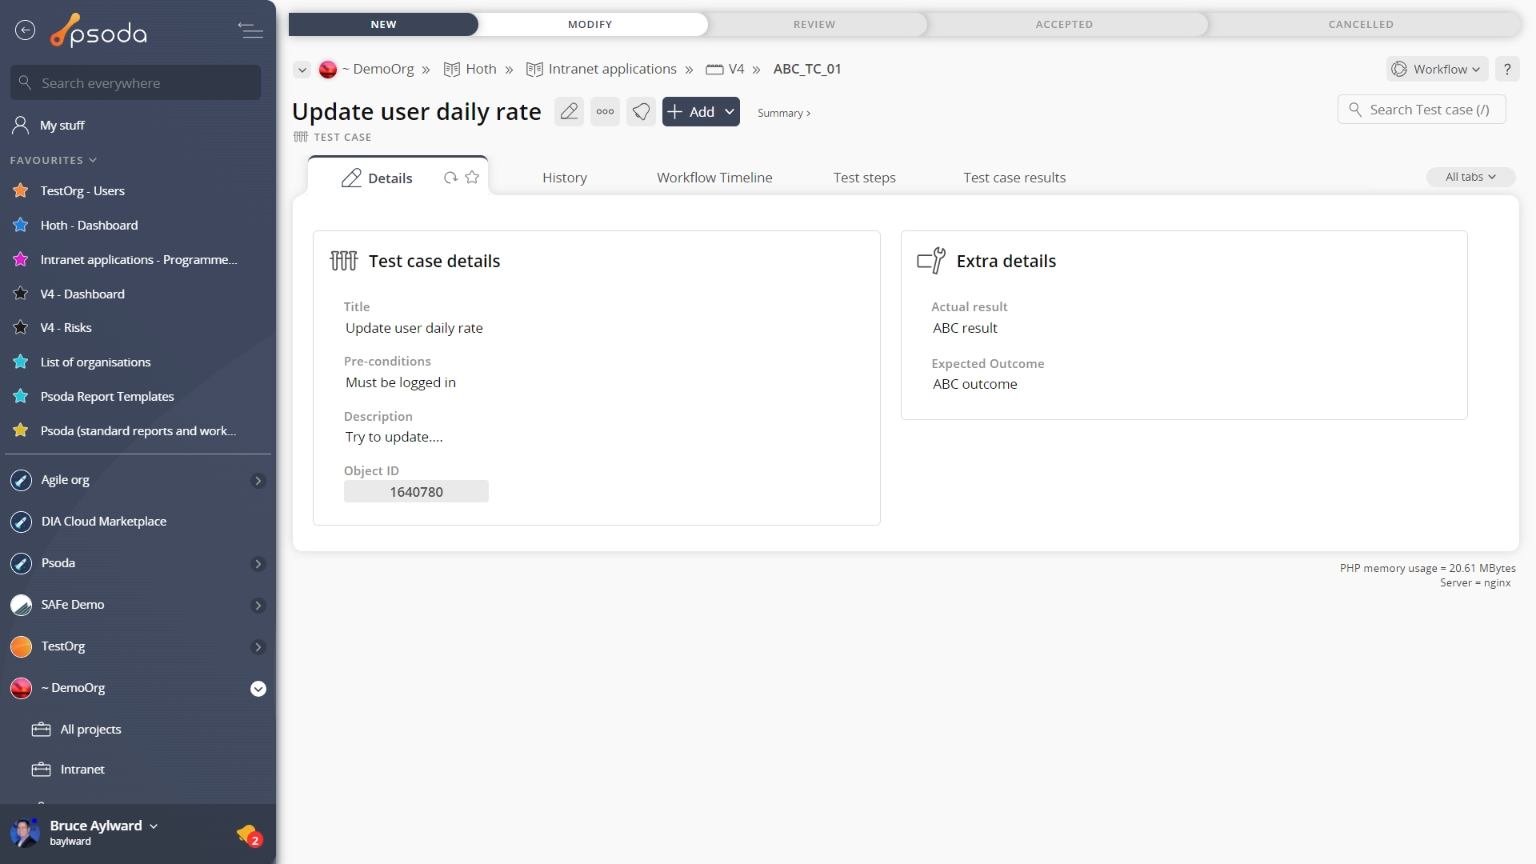
Figure 1 – Test case view page
The top header area allows you to Attachments
This tab shows an asset listing of all of the attachments that have been added to this test case, as shown in Figure 2. By default, this table will present you with a number of details about the attachments such as the file’s name, attachment type, view the version and access a download link.
From the Actions column of this attachments table, you can act on individual attachments by 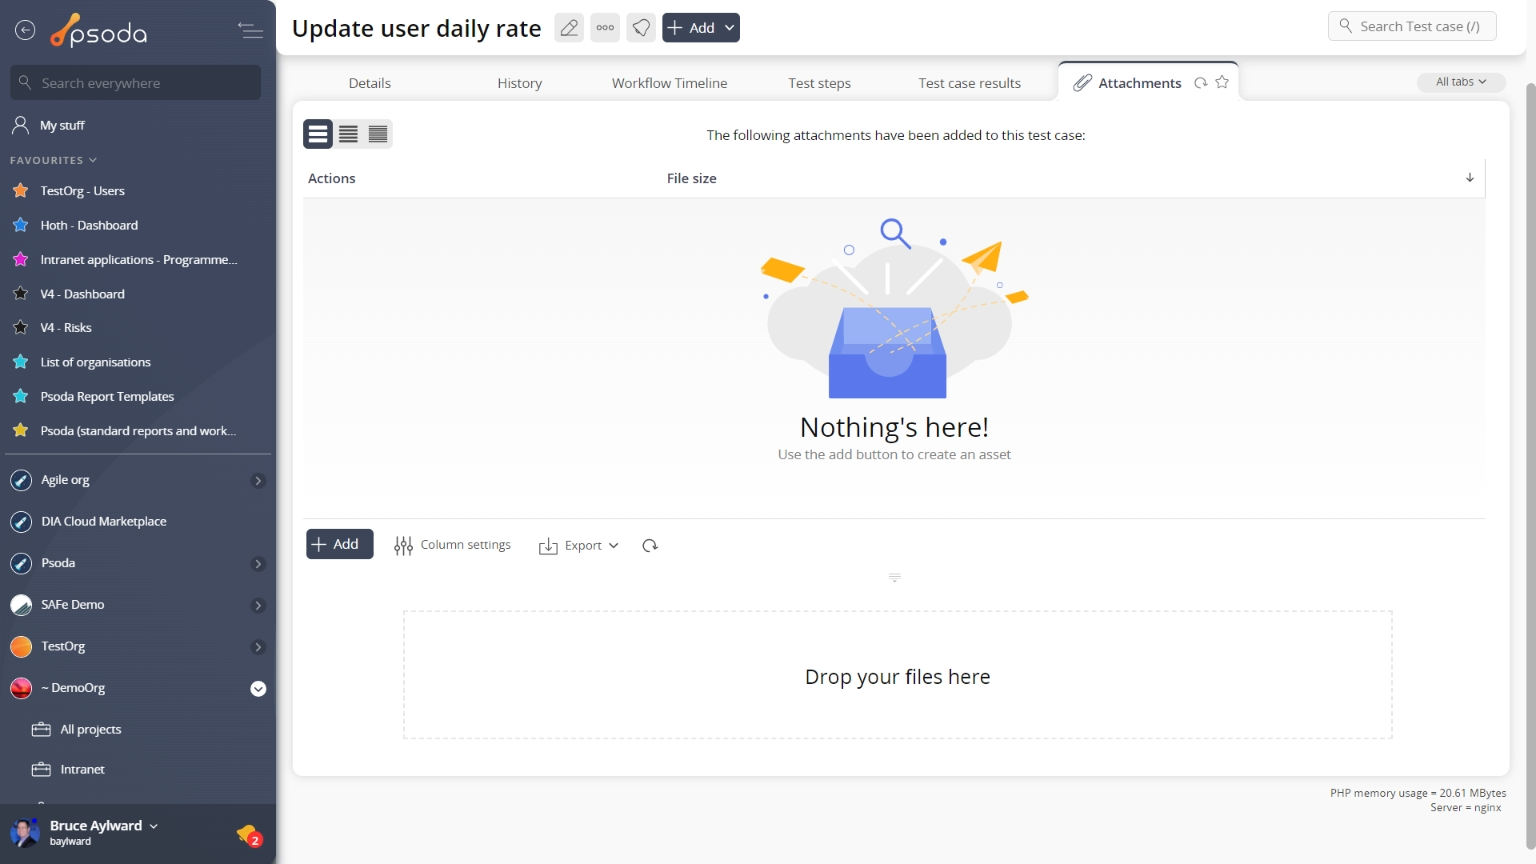
Figure 2 – Test case attachments tab
Note that you can customise your table view by clicking the Comments
This tab shows an asset listing of all of the comments that 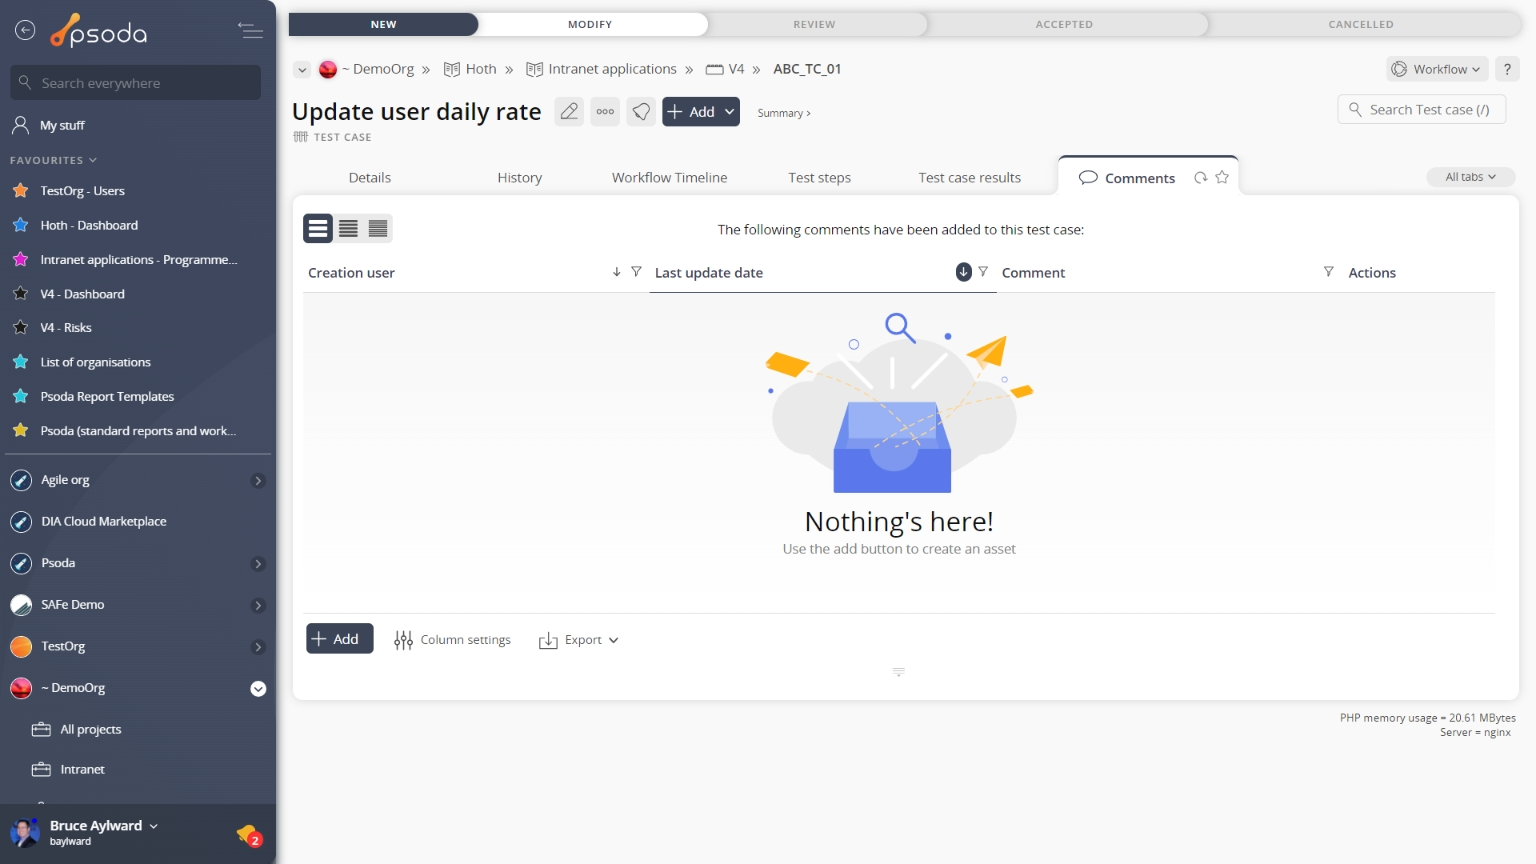
Figure 3 – Test case comments tab
Note that you can customise your table view by clicking the Defects
This tab shows an asset listing of all of the defects that have been logged for this test case, as shown in Figure 4. By default, this table will present you with a number of details about the defects such as the defect’s number, type, title, severity, priority, current state, date raised, resolve by date and which user this defect is allocated to, to name a few details.
From the Actions column of this defects table, you can act on individual defects by 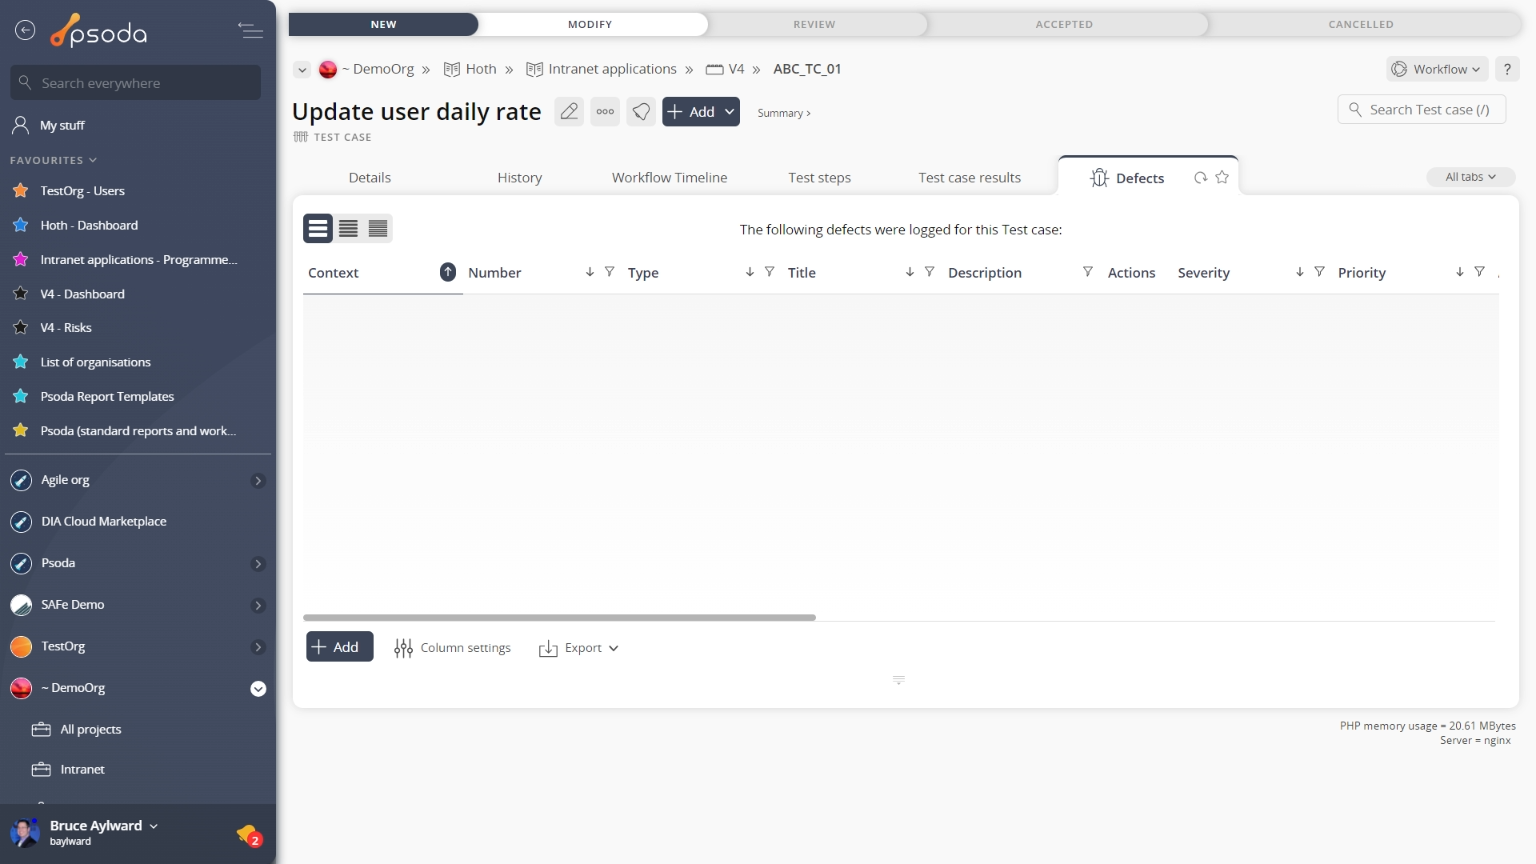
Figure 4 – Test case defects tab
Note that you can customise your table view by clicking the ![]() edit button at the bottom of the defect table. Here, you can also export this list to
edit button at the bottom of the defect table. Here, you can also export this list to ![]() Excel or
Excel or ![]() CSV files.
CSV files.
 Dependents
Dependents are other assets, for example test steps, that “depends” on this test case i.e. those assets may be affected if the details of this test case should change.
This tab shows an asset listing of all of the dependents that have been added to this test case, as shown in Figure 5. By default, this table will present you with the dependent’s parent asset, the dependent asset, it’s description and status.
From the Actions column of this dependents table, you can act on individual dependents by 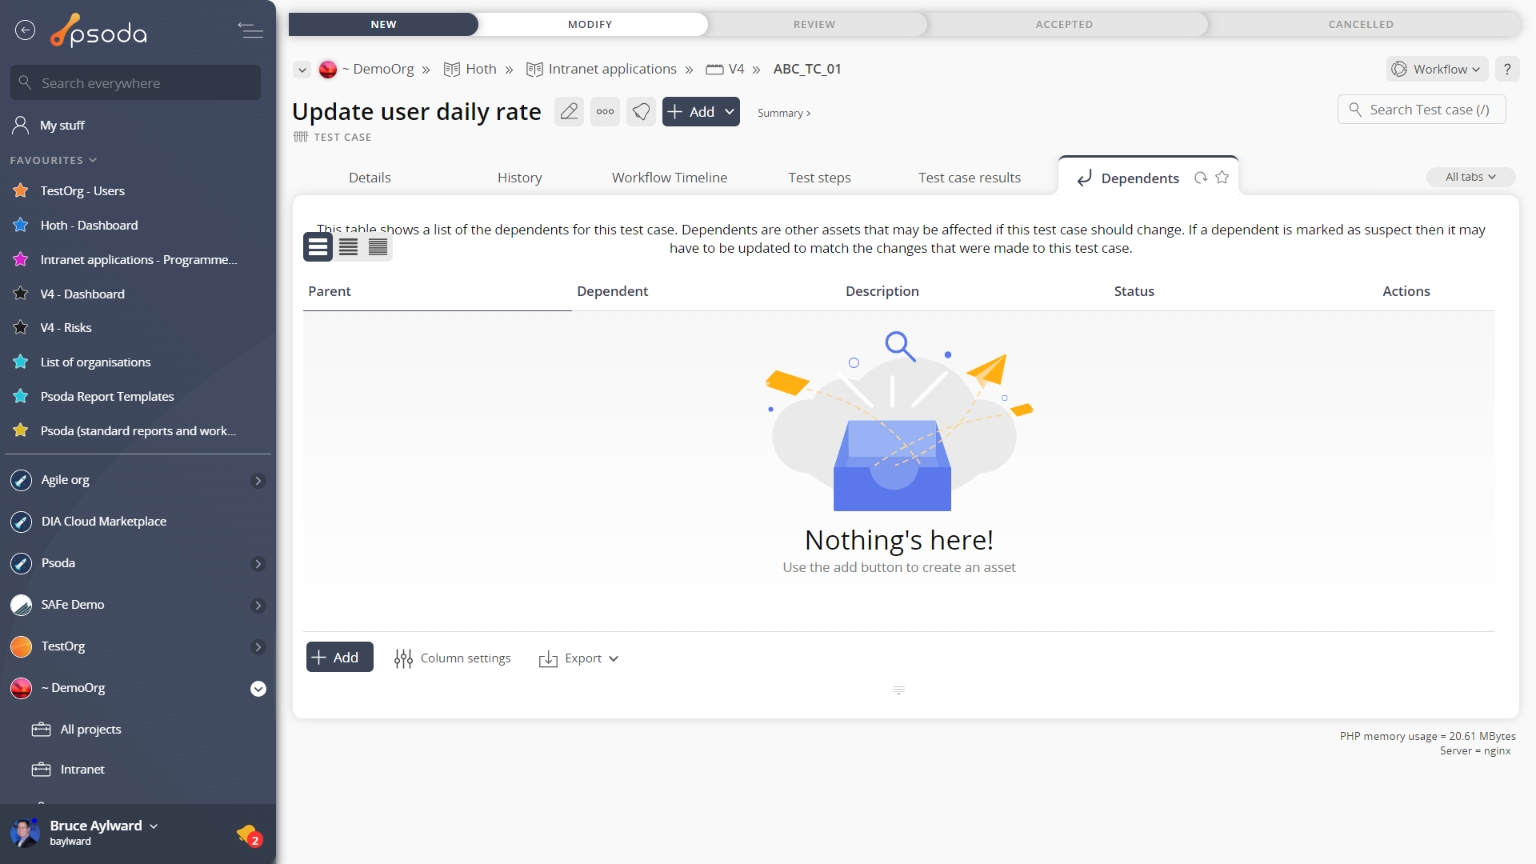
Figure 5 – Test case dependents tab
Note that you can customise your table view by clicking the ![]() edit button at the bottom of the dependents table or navigate to this same spot to
edit button at the bottom of the dependents table or navigate to this same spot to ![]() add more dependents to this test case. Here, you can also export this list to
add more dependents to this test case. Here, you can also export this list to ![]() Excel or
Excel or ![]() CSV files.
CSV files.
 Details
This tab shows some additional details on the test case such as it’s title, pre-conditions and description, as shown in Figure 6.
Figure 6 – Test case details tab
Some fields may allow for inline editing although these permissions may be linked to your access rights. If you feel that you should have access to some of these permissions, contact your System Administrator. History
This tab shows shows some basic history of the test case, as shown in Figure 7. By default, this tab will present you with a number of details about the test case’s history such as the creation date, creation user, last update date and last update user. If the test case has been changed then this section will also show a table of all the changes that has been made, including the date of each change, the field changed, the value before the change and the user who made the change.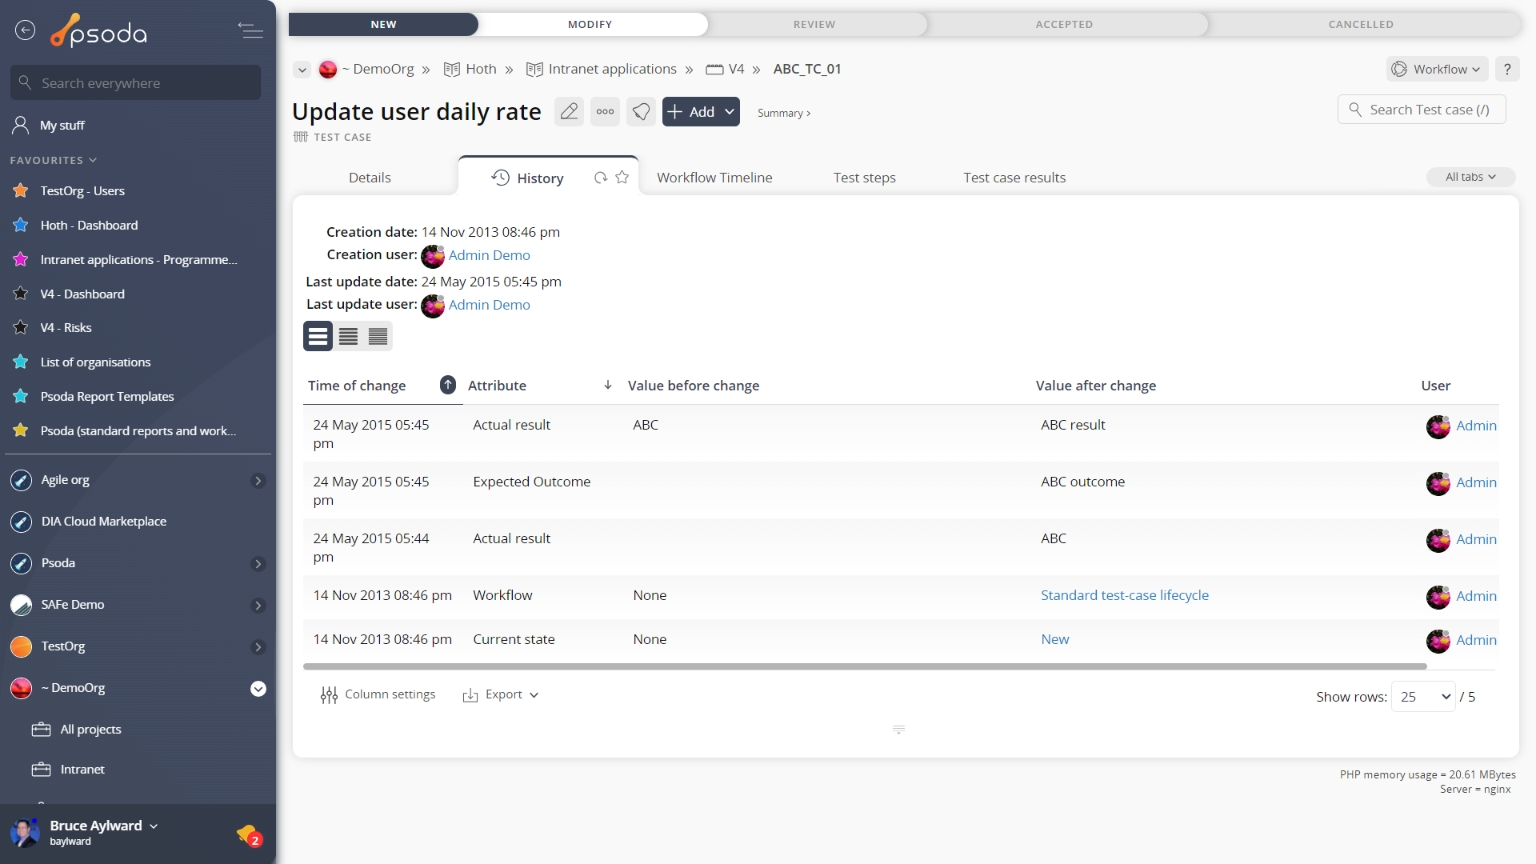
Figure 7 – Test case history tab
Note that you can customise your change table view by clicking the ![]() edit button at the bottom of the change table. Here, you can also export this list of changes to
edit button at the bottom of the change table. Here, you can also export this list of changes to ![]() Excel or
Excel or ![]() CSV files.
CSV files.
Sources
Sources are other assets that this test case is derived from, i.e. this test case can be affected if any of its sources are changed.
This tab shows an asset listing of all of the sources that have been added to this test case, as shown in Figure 8. By default, this table will present you with the source’s parent asset, the source asset, it’s description and status.
From the Actions column of this sources table, you can act on individual sources by 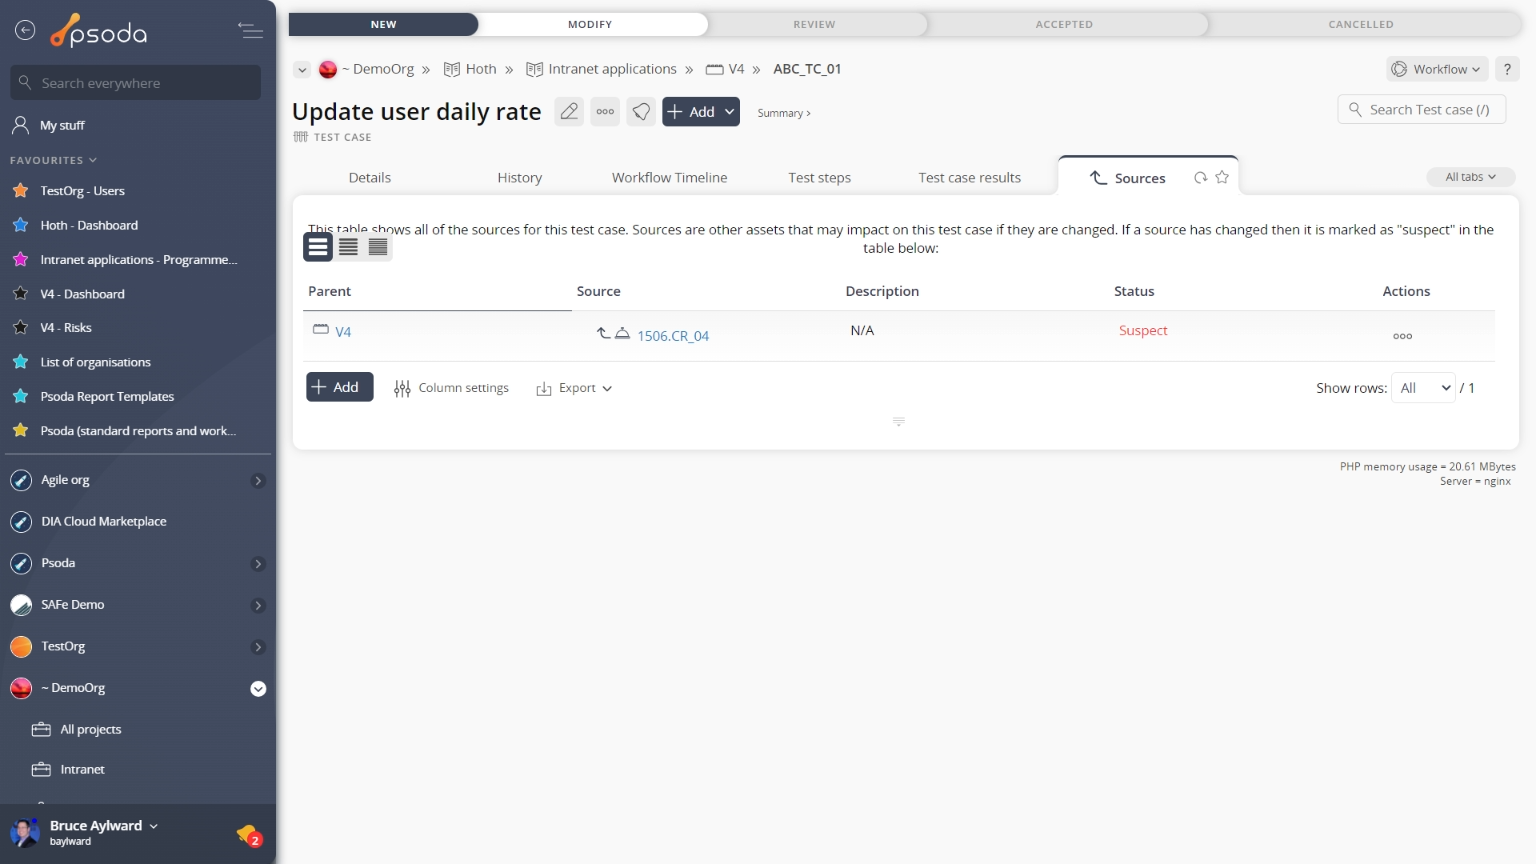
Figure 8 – Test case sources tab
Note that you can customise your table view by clicking the ![]() edit button at the bottom of the sources table or navigate to this same spot to
edit button at the bottom of the sources table or navigate to this same spot to ![]() add more sources to this test case. Here, you can also export this list to
add more sources to this test case. Here, you can also export this list to ![]() Excel or
Excel or ![]() CSV files.
CSV files.
Test case results
This tab shows an asset listing of all of the test case results that have been captured for this test case, as shown in Figure 9. By default, this table will present you with the test case result’s last update date. reference, title, pre-conditions, description, progress and passrate bars, status and which test run is associated. If you click on the link under the reference column, you will navigate into the selected test case result’s view page.
From the Actions column of this test case results table, you can act on individual results by 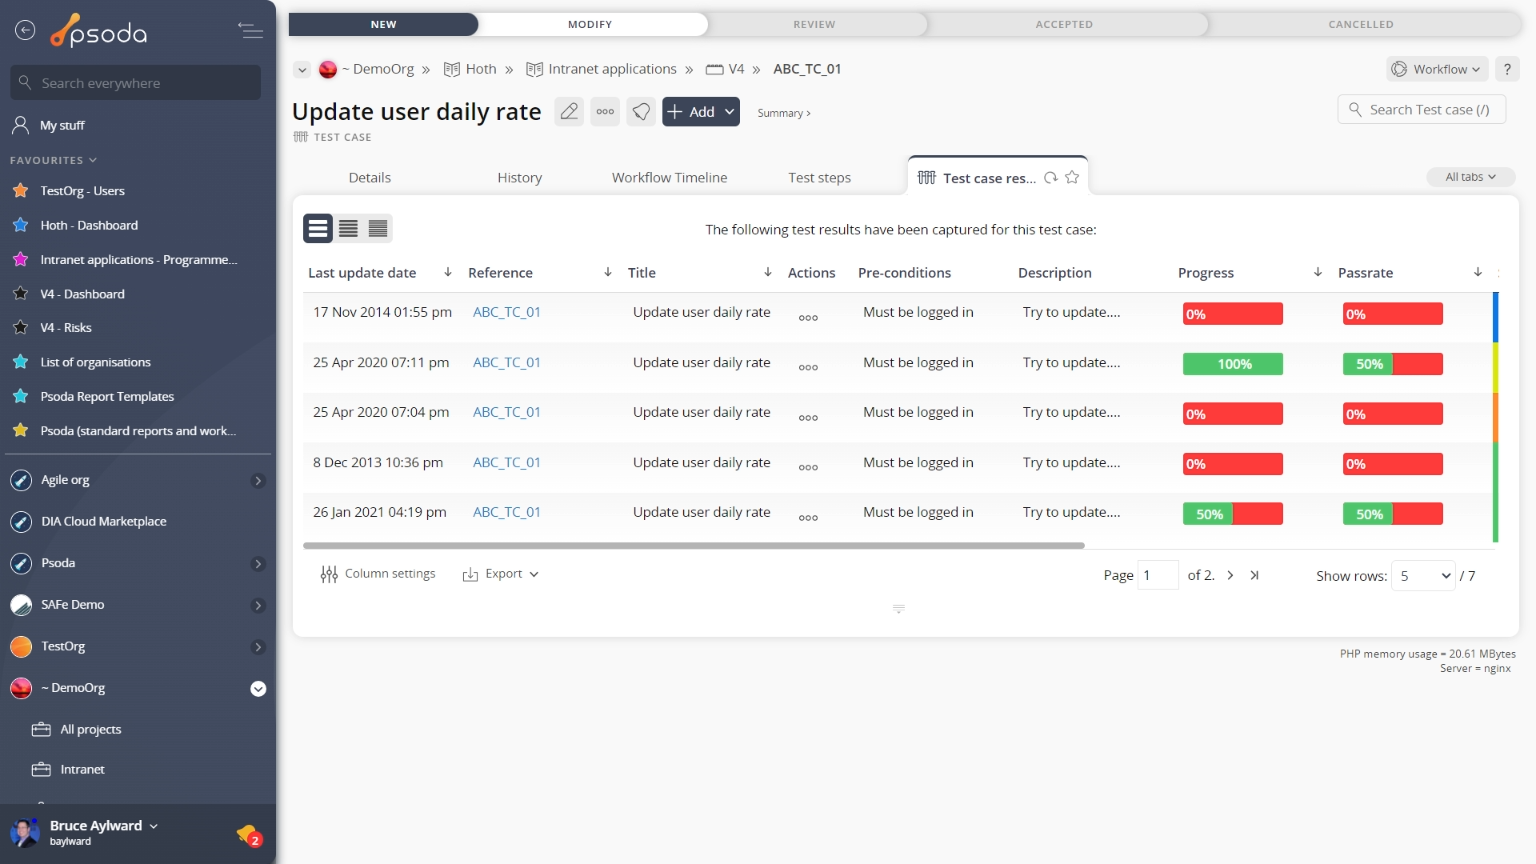
Figure 9 – Test case test case results tab
Note that you can customise your table view by clicking the ![]() edit button at the bottom of the test case results table. Here, you can also export this list to
edit button at the bottom of the test case results table. Here, you can also export this list to ![]() Excel or
Excel or ![]() CSV files.
CSV files.
 Test steps
This tab shows an asset listing of all of the test steps that make up this test case, as shown in Figure 10. By default, this table will present you with the test step’s description, expected outcome, and the number of comments or attachments associated with this test step. If you click on the link under the step column, you will navigate into the selected test step’s view page.
From the Actions column of this test steps table, you can act on individual test steps by 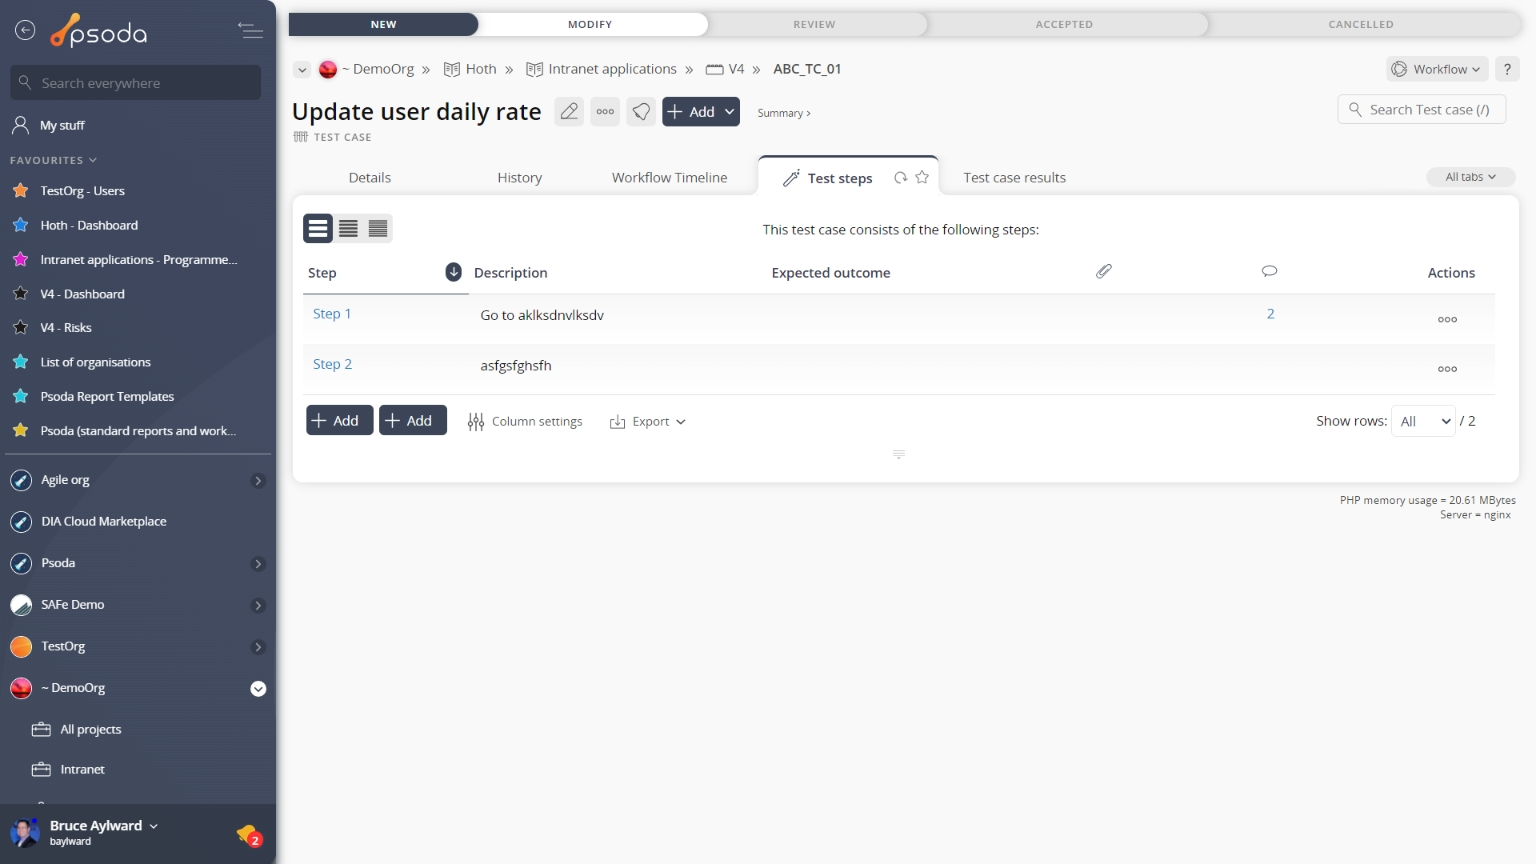
Figure 10 – Test case test steps tab
Note that you can customise your table view by clicking the ![]() edit button at the bottom of the test steps table or navigate to this same spot to
edit button at the bottom of the test steps table or navigate to this same spot to ![]() add more test steps to this test case. Here, you can also export this list to
add more test steps to this test case. Here, you can also export this list to ![]() Excel or
Excel or ![]() CSV files.
CSV files.
Workflow timeline
This tab shows you a table containing each of the state transitions that have been applied to this test case on the applied workflow. Note that you can customise your table view by clicking the 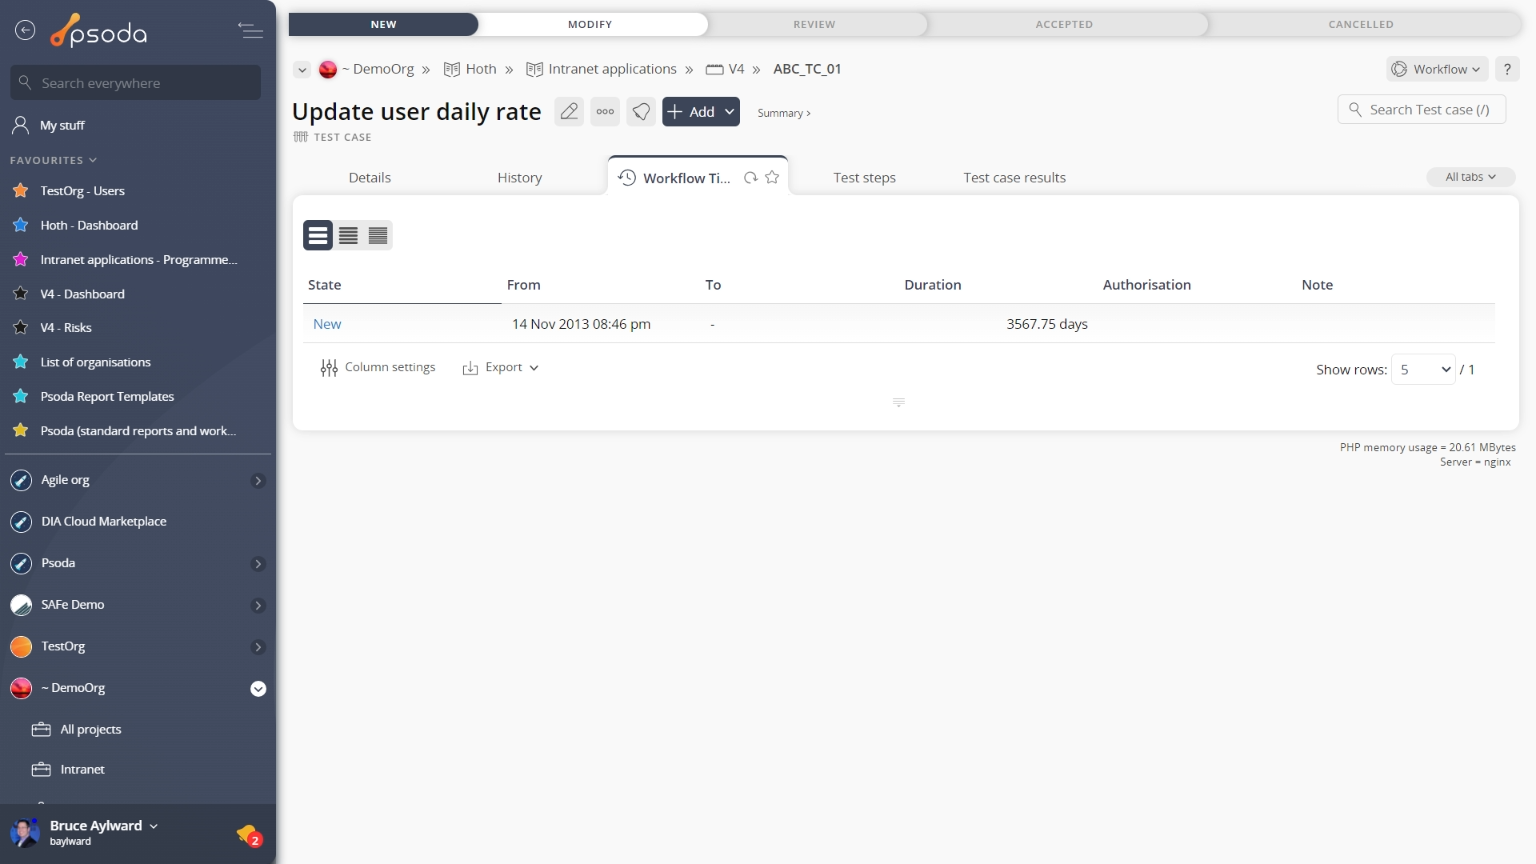 Figure 11 – Test case workflow timeline tab
Below the state transition timeline table, you will be presented with a visual breakdown of the timeline in a GANTT chart, as shown in Figure 11.