This page is shown in Figure 1 and shows all the information relating to the selected  indicator.

 edit,
edit,  delete,
  move,
move,  merge or
  copy the indicator. You can also
  add new indicator values.
Some details of the indicator are displayed just below the top header area, for example the section, description, classes and read-only status of this indicator. There is also an additional area where the indicator’s workflow information is displayed. The rest of the page is made up of a number of tabs or sections (depending on your selected view):
add new indicator values.
Some details of the indicator are displayed just below the top header area, for example the section, description, classes and read-only status of this indicator. There is also an additional area where the indicator’s workflow information is displayed. The rest of the page is made up of a number of tabs or sections (depending on your selected view):
This tab shows an asset listing of all of the indicator values that have been added to this indicator, as shown in Figure 2. By default, this table will present you with a number of details about the indicator values such as the name, description and score. If you select the link under the name column, you will navigate into the indicator value’s view page.
From the Actions column of this indicator values table, you can act on individual values by editing or deleting the selected value.
This tab shows shows some basic history of the indicator, as shown in Figure 3. By default, this tab will present you with a number of details about the indicator’s history such as the creation date, creation user, last update date and last update user. If the indicator has been changed then this section will also show a table of all the changes that has been made, including the date of each change, the field changed, the value before the change and the user who made the change.
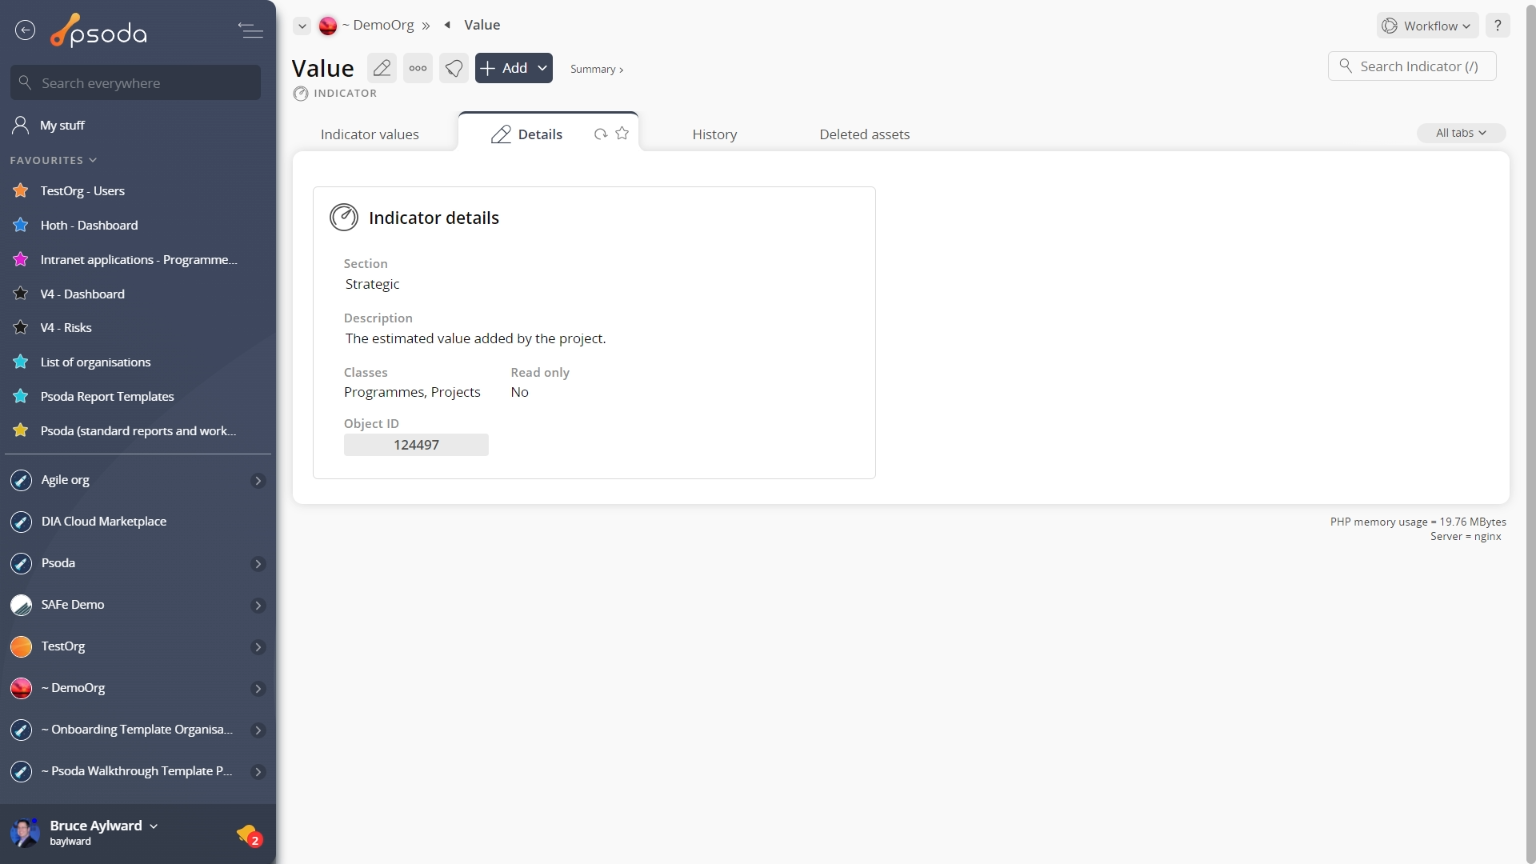
Figure 1 – Indicator view page
The top header area allows you to Indicator values
This tab shows an asset listing of all of the indicator values that have been added to this indicator, as shown in Figure 2. By default, this table will present you with a number of details about the indicator values such as the name, description and score. If you select the link under the name column, you will navigate into the indicator value’s view page.
From the Actions column of this indicator values table, you can act on individual values by 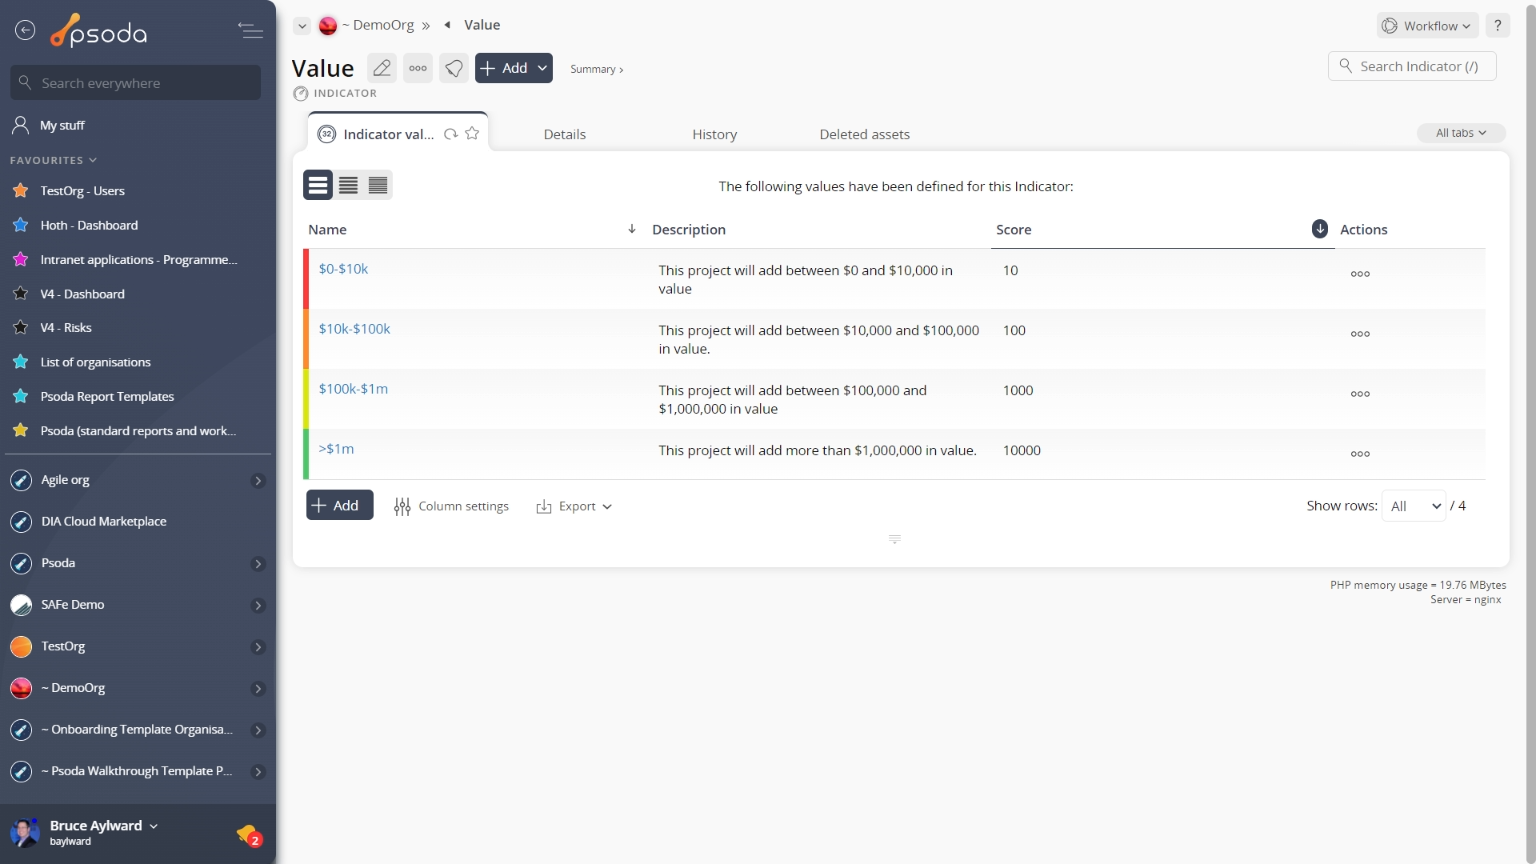
Figure 2 – Indicator indicator values table
Note that you can customise your table view by clicking the ![]() edit button at the bottom of the indicator values table or navigate to this same spot to
edit button at the bottom of the indicator values table or navigate to this same spot to ![]() add more indicator values to this indicator. Here, you can also export this list to
add more indicator values to this indicator. Here, you can also export this list to ![]() Excel or
Excel or ![]() CSV files.
CSV files.
 History
This tab shows shows some basic history of the indicator, as shown in Figure 3. By default, this tab will present you with a number of details about the indicator’s history such as the creation date, creation user, last update date and last update user. If the indicator has been changed then this section will also show a table of all the changes that has been made, including the date of each change, the field changed, the value before the change and the user who made the change.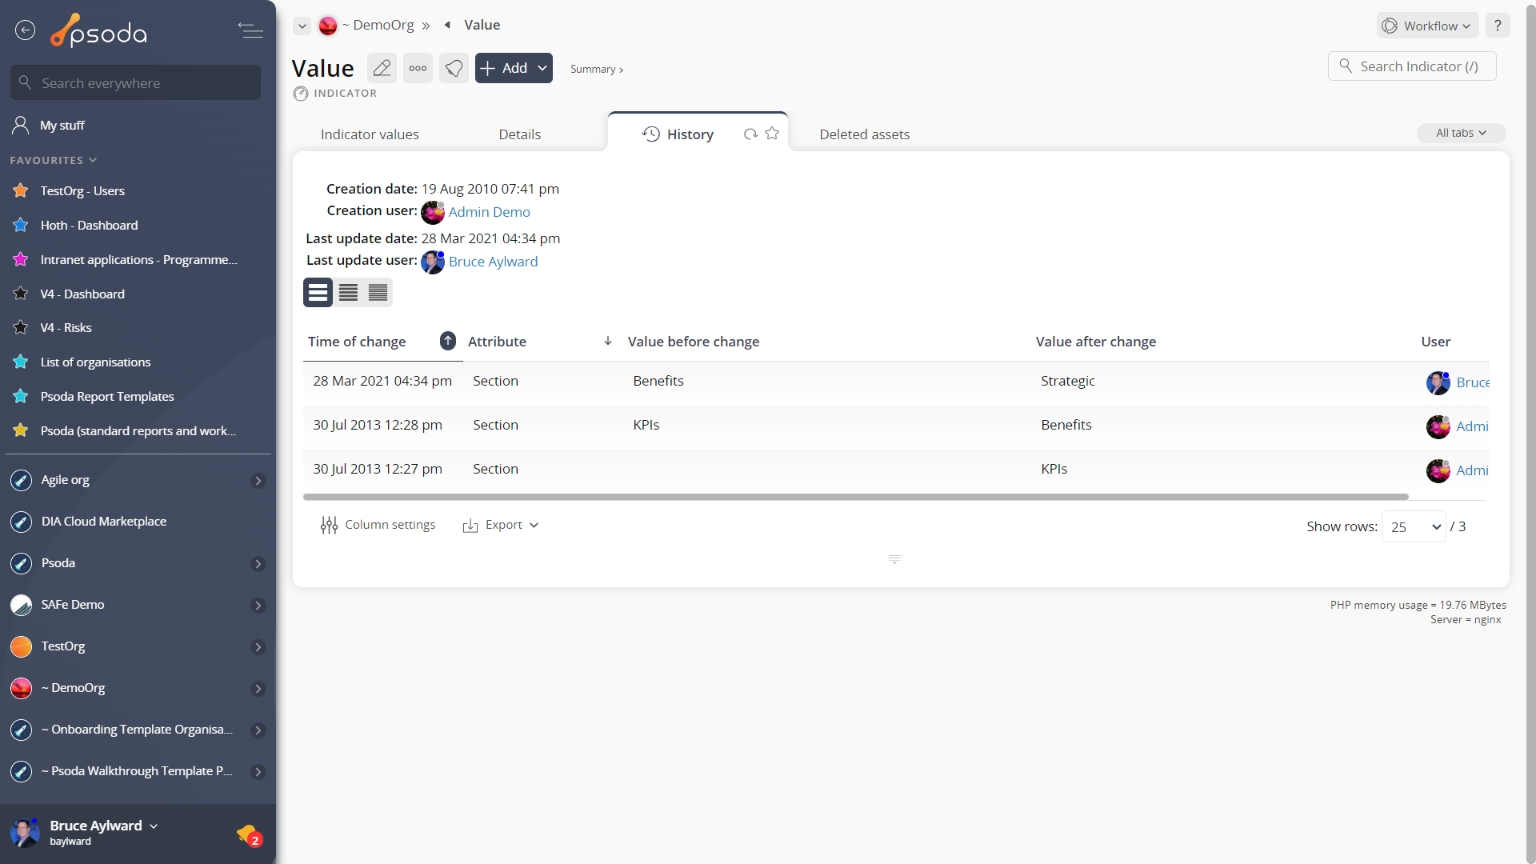
Figure 3 – Indicator history tab
Note that you can customise your change table view by clicking the ![]() edit button at the bottom of the change table. Here, you can also export this list of changes to
edit button at the bottom of the change table. Here, you can also export this list of changes to ![]() Excel or
Excel or ![]() CSV files.
CSV files.