Figure 1 – Folder view page
The top header area allows you to Attachments
This tab shows an asset listing of all of the attachments that have been added to this folder, as shown in Figure 2. By default, this table will present you with a number of details about the attachments such as the file’s name, attachment type, view the version and access a download link.
From the Actions column of this attachments table, you can act on individual attachments by 
Figure 2 – Folder attachments tab
Note that you can customise your table view by clicking the Defects
This tab shows an asset listing of all of the defects that have been logged for this folder, as shown in Figure 3. By default, this table will present you with a number of details about the defects such as the defect’s number, type, title, severity, priority, current state, date raised, resolve by date and which user this defect is allocated to, to name a few details.
From the Actions column of this defects table, you can act on individual defects by 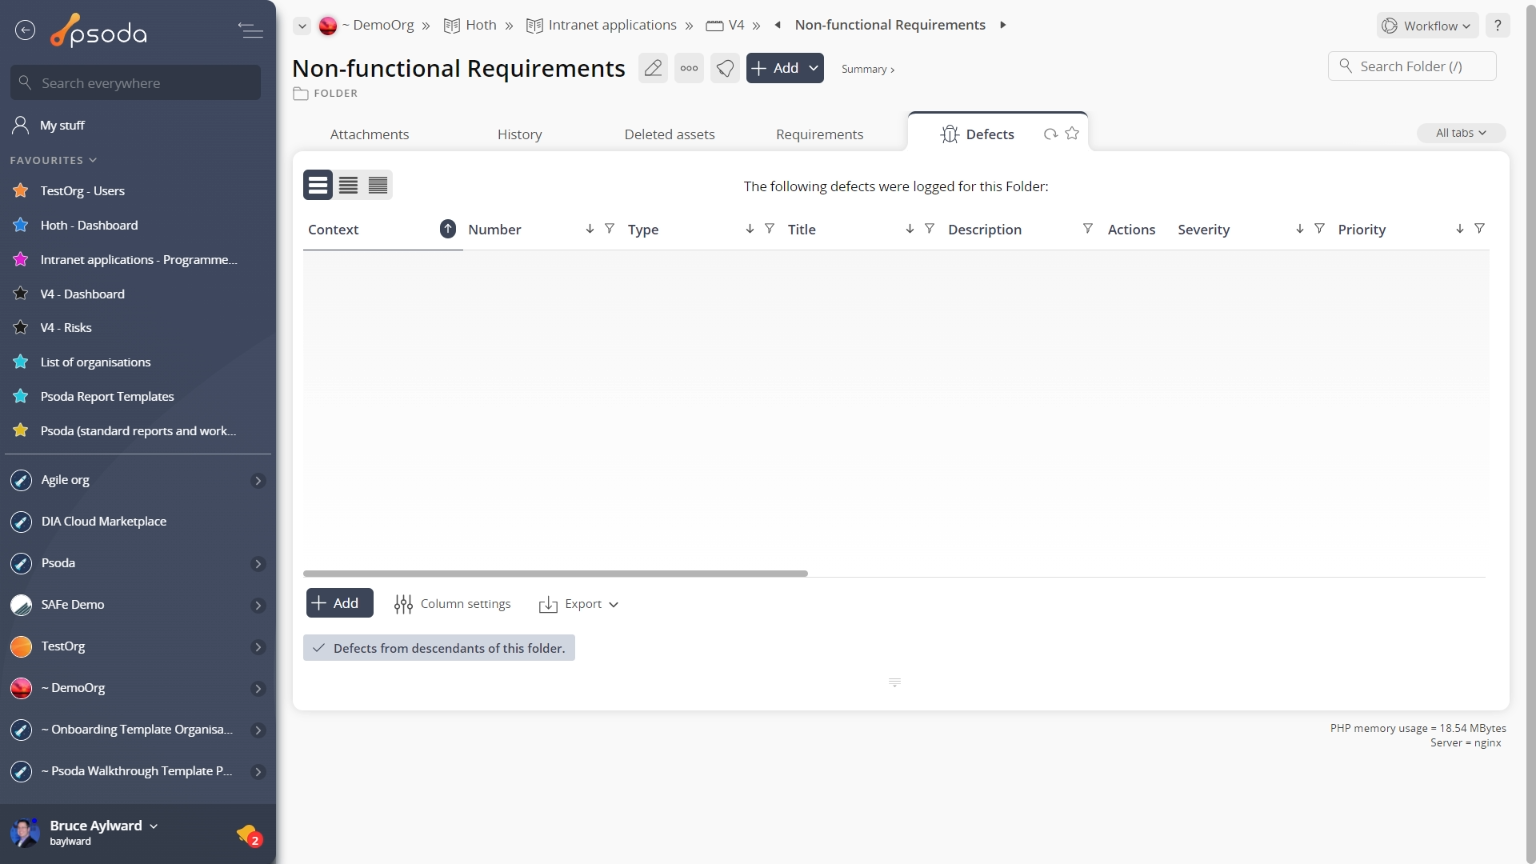
Figure 3 – Folder defects tab
Note that you can customise your table view by clicking the ![]() edit button at the bottom of the defect table or navigate to this same spot to
edit button at the bottom of the defect table or navigate to this same spot to ![]() add more defects to this folder. Here, you can also export this list to
add more defects to this folder. Here, you can also export this list to ![]() Excel or
Excel or ![]() CSV files.
CSV files.
At the very bottom of this tab you may also be presented with the option to reduce the number of defects listed by selecting the hide defects for children of this folder link.
Defects overview
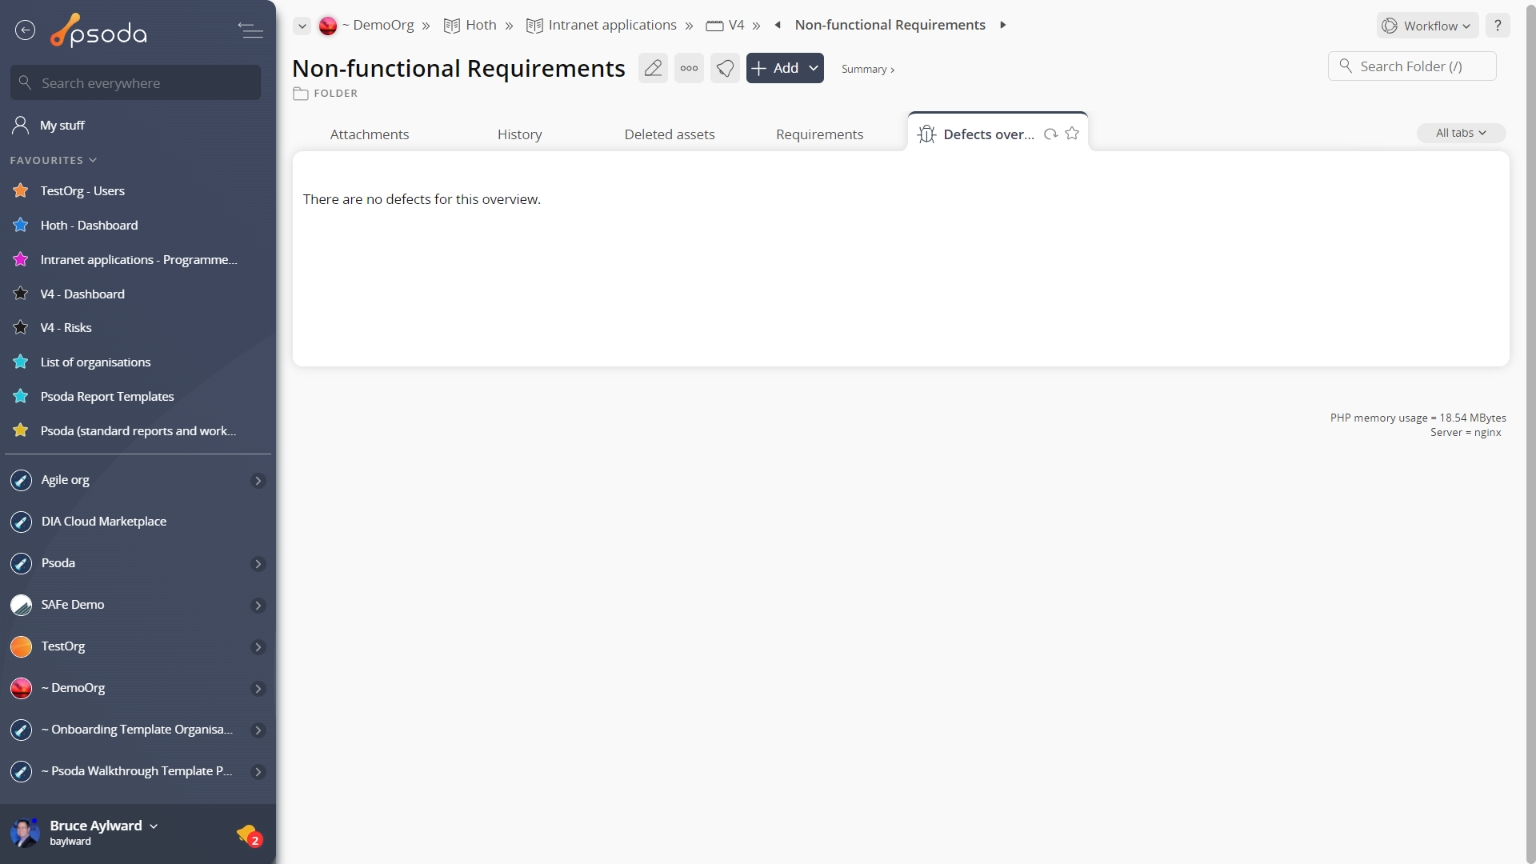
Figure 4 – Folder defects overview tab
Instead of a table view, this tab provides a graphical view of your defects by presenting a number of graphs grouping defects by certain categories, as shown in Figure 4. The defects overview charts are generated by information in the defects tab.
 Deleted assets
This tab shows an asset listing of all of the assets that 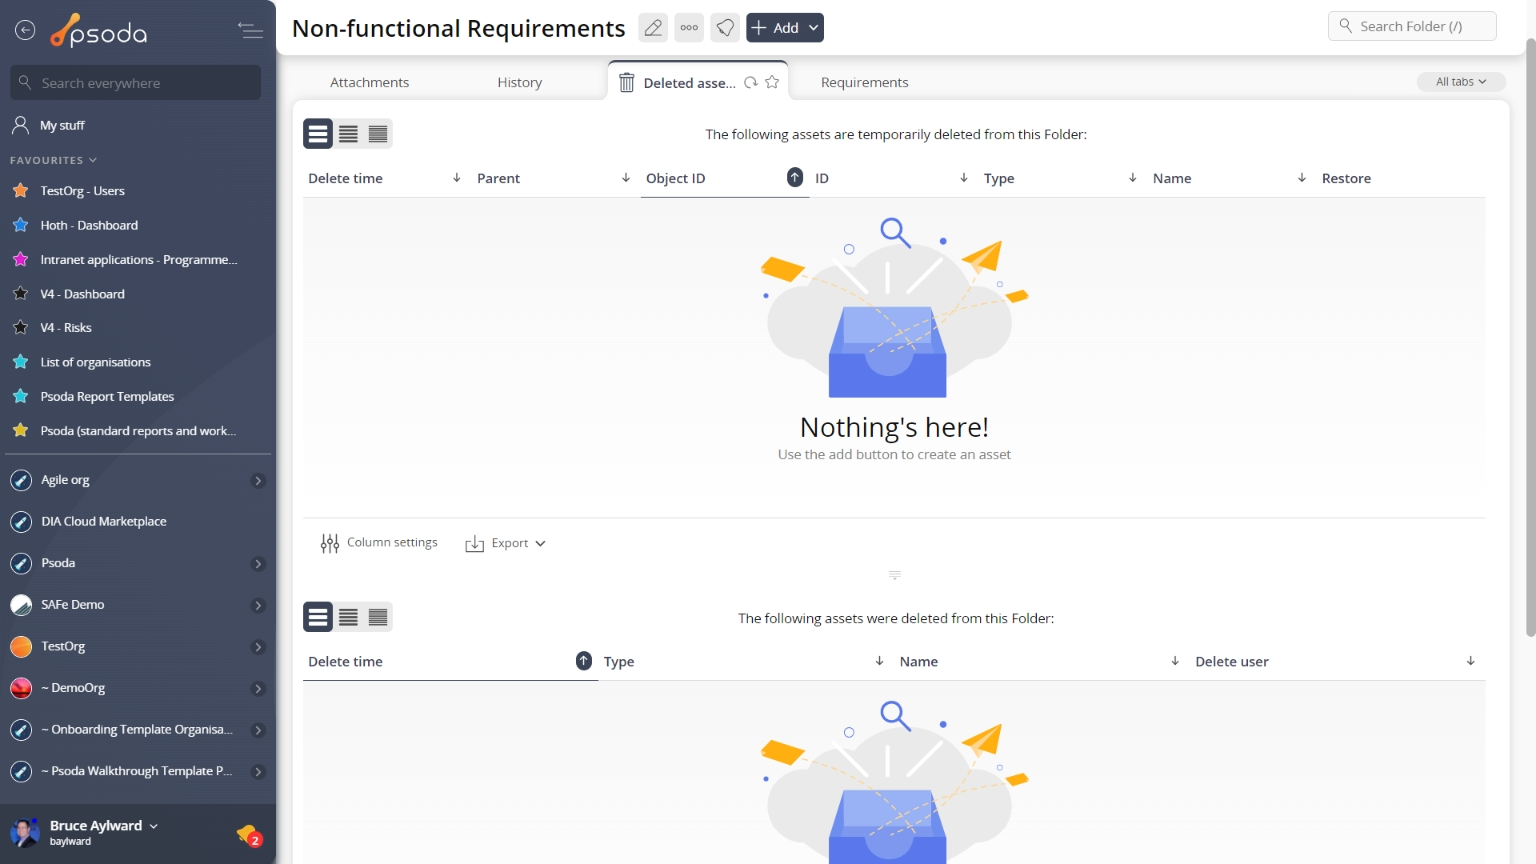
Figure 5 – Folder deleted assets tab
Note that you can customise your table view by clicking the ![]() edit button at the bottom of the tables. Here, you can also export the list to
edit button at the bottom of the tables. Here, you can also export the list to ![]() Excel or
Excel or ![]() CSV files.
CSV files.
 History
This tab shows shows some basic history of the folder, as shown in Figure 6. By default, this tab will present you with a number of details about the folder’s history such as the creation date, creation user, last update date and last update user. If the folder has been changed then this section will also show a table of all the changes that has been made, including the date of each change, the field changed, the value before the change and the user who made the change.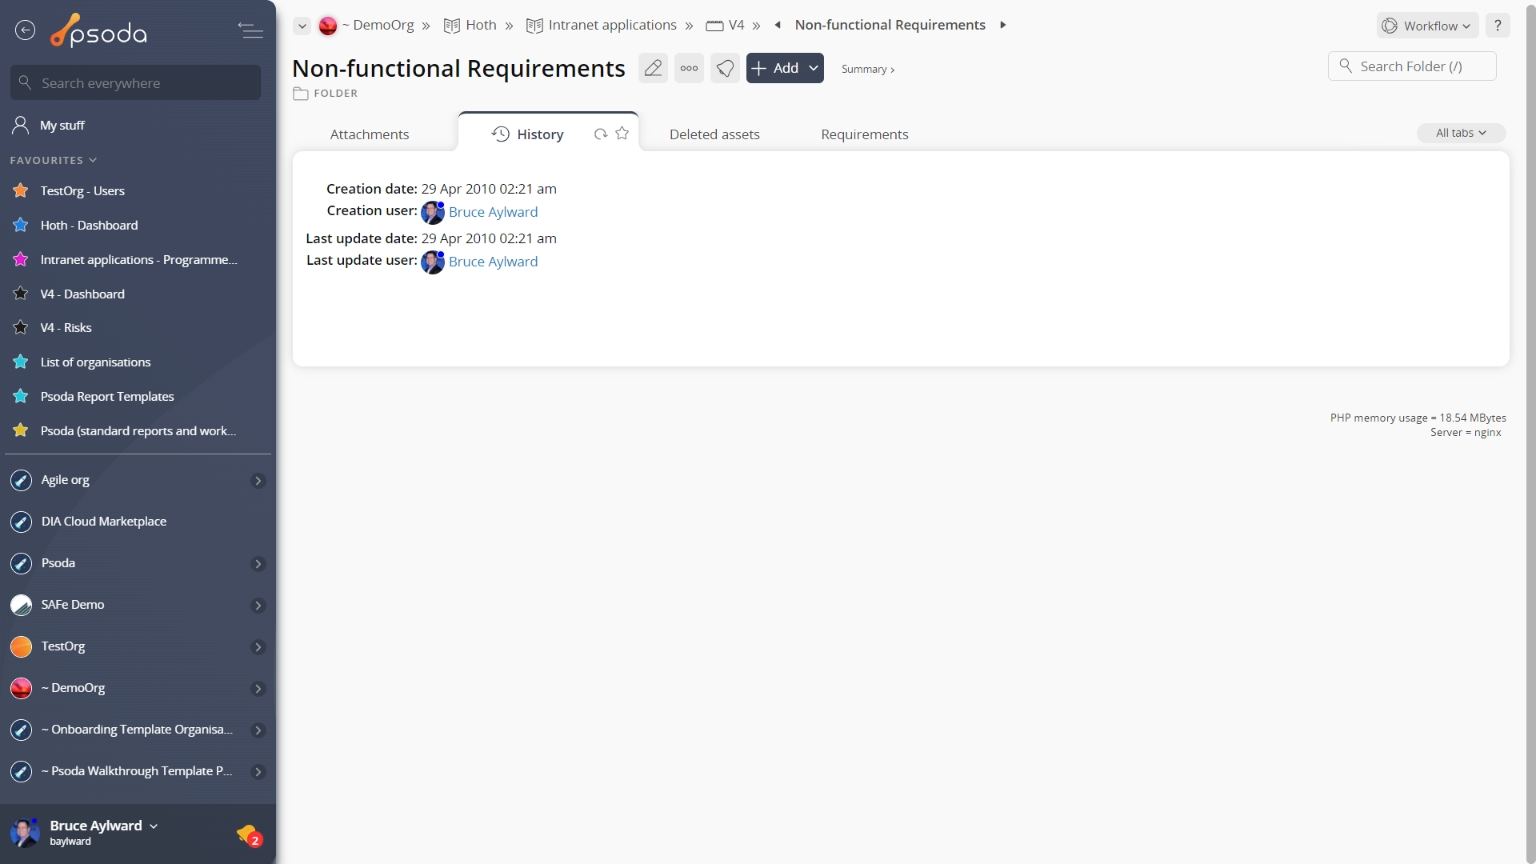
Figure 6 – Folder history tab
Note that you can customise your change table view by clicking the ![]() edit button at the bottom of the change table. Here, you can also export this list of changes to
edit button at the bottom of the change table. Here, you can also export this list of changes to ![]() Excel or
Excel or ![]() CSV files.
CSV files.
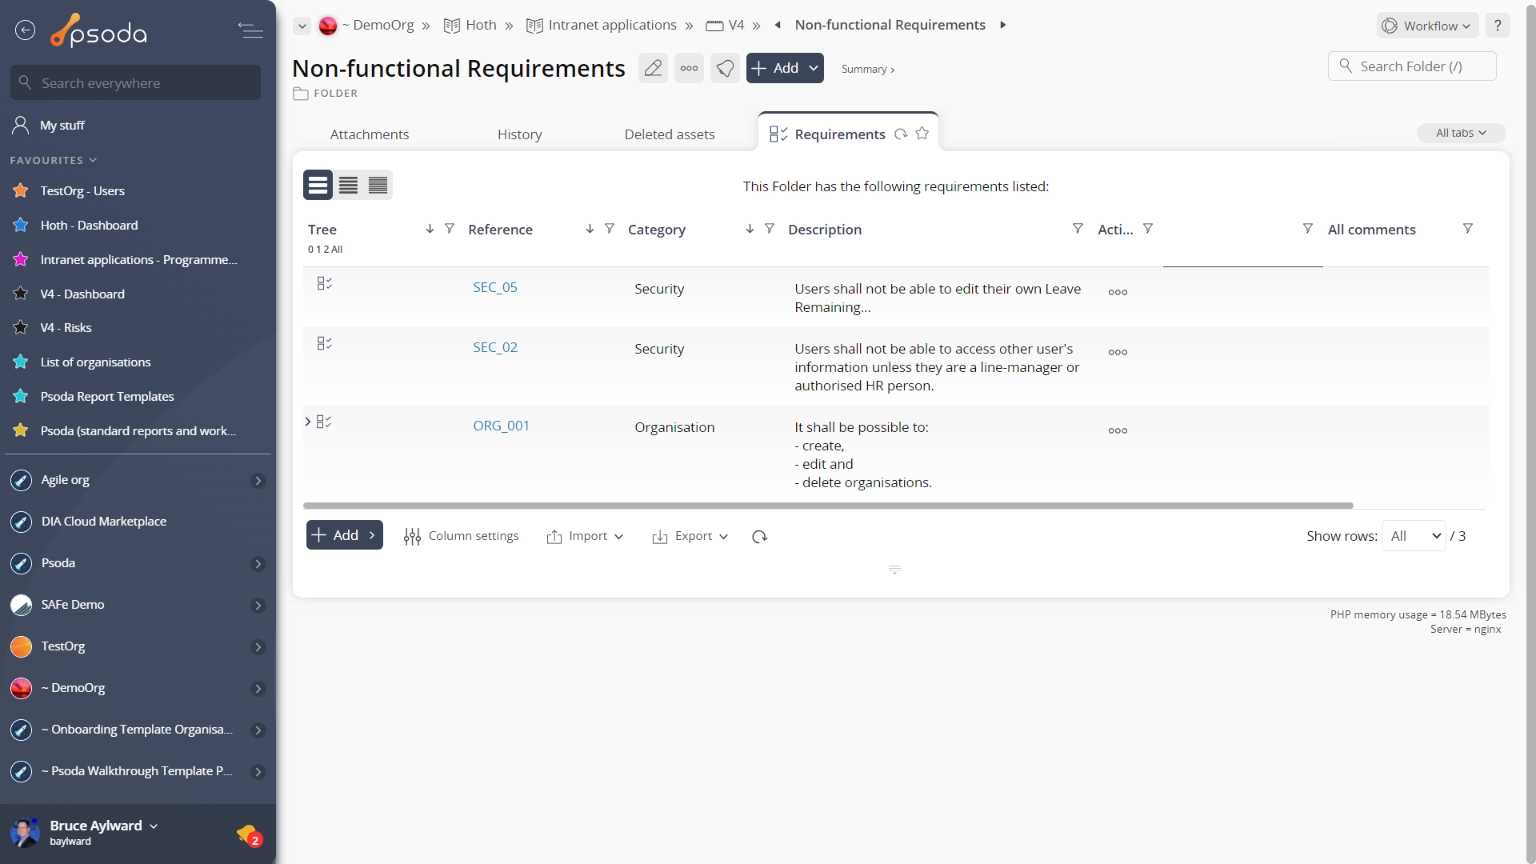
 Requirements
This tab shows an asset listing of all of the requirements that have been added to this folder, as shown in Figure 7. If you click on the link in the reference column, you will navigate into the selected requirement’s view page. By default this requirements table will list some details for the requirements such as the reference, category, description, priority, weighting and current state.
From the Actions column of this requirements table, you can act on individual requirements by
Figure 7 – Folder requirements tab
Note that you can customise your table view by clicking the Test cases
This tab shows an asset listing of all of the test cases that have been listed for this folder, as shown in Figure 8. If you click on the link in the reference column, you will navigate into the selected test case’s view page. By default this test cases table will show some details of the listed test cases such as the reference, title, pre-conditions, description, requirement being tested, current state and the last result.
From the Actions column of this test cases table, you can act on individual test cases by 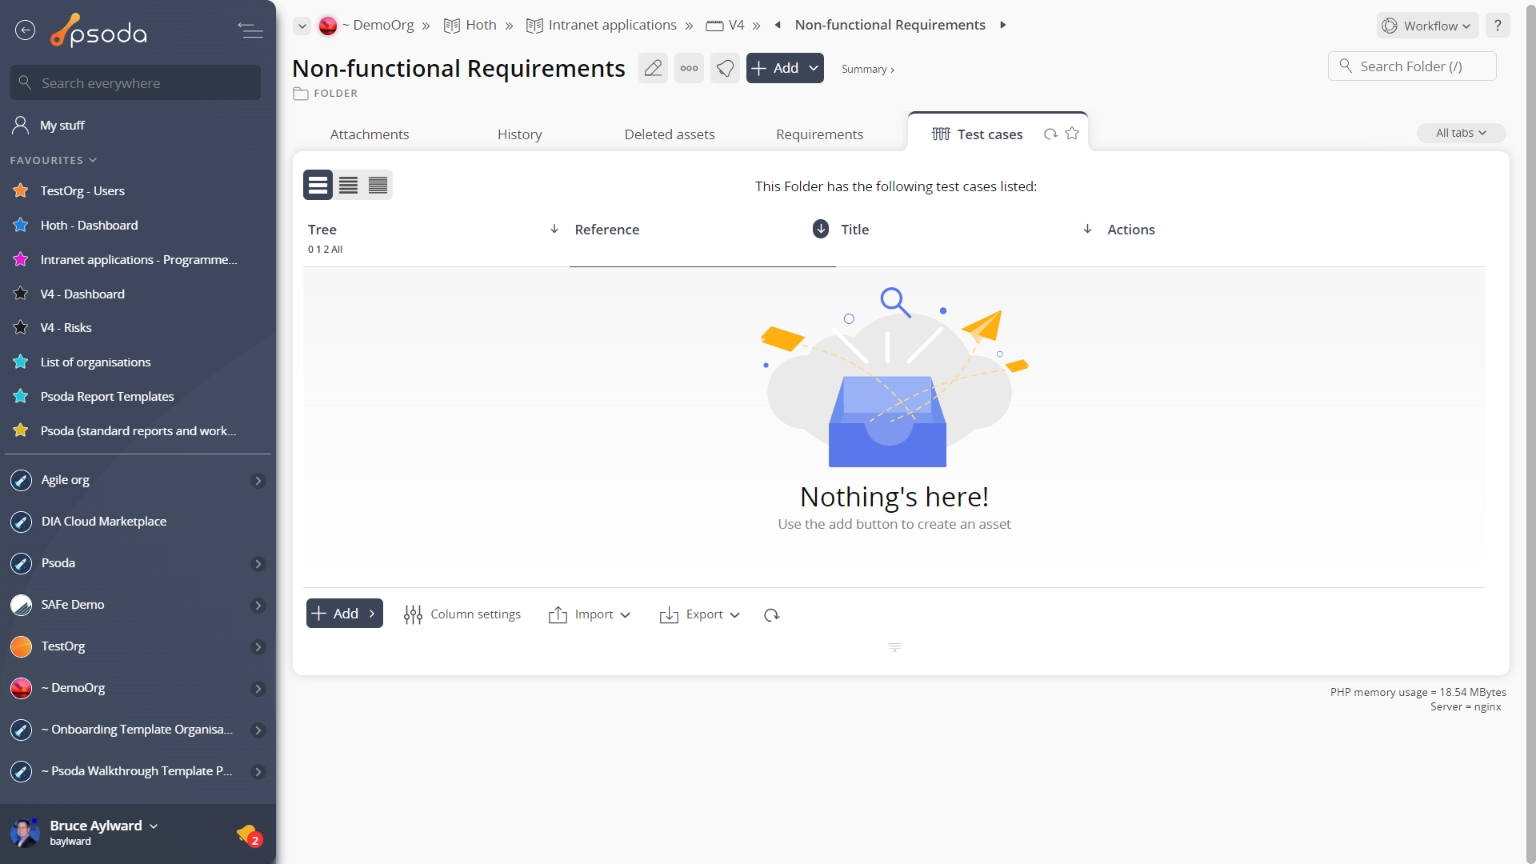
Figure 8 – Folder test cases tab
At the bottom of the table you can add more ![]() sub-folders or
sub-folders or ![]() test cases manually or
test cases manually or ![]() import multiple from a CSV file. Note that you can customise your table view by clicking the
import multiple from a CSV file. Note that you can customise your table view by clicking the ![]() edit button from here too, as well as being able to export this list to
edit button from here too, as well as being able to export this list to ![]() Excel or
Excel or ![]() CSV files.
CSV files.
 Test runs
This tab shows an asset listing of all of the test runs that have been listed for this folder, as shown in Figure 9. If you click on the link in the short name column, you will navigate into the selected test run’s view page. By default this test runs table will show some details of the listed test runs such as the short name, description, progress, passrate, context and status to name a few.
From the Actions column of this test runs table, you can act on individual test runs by 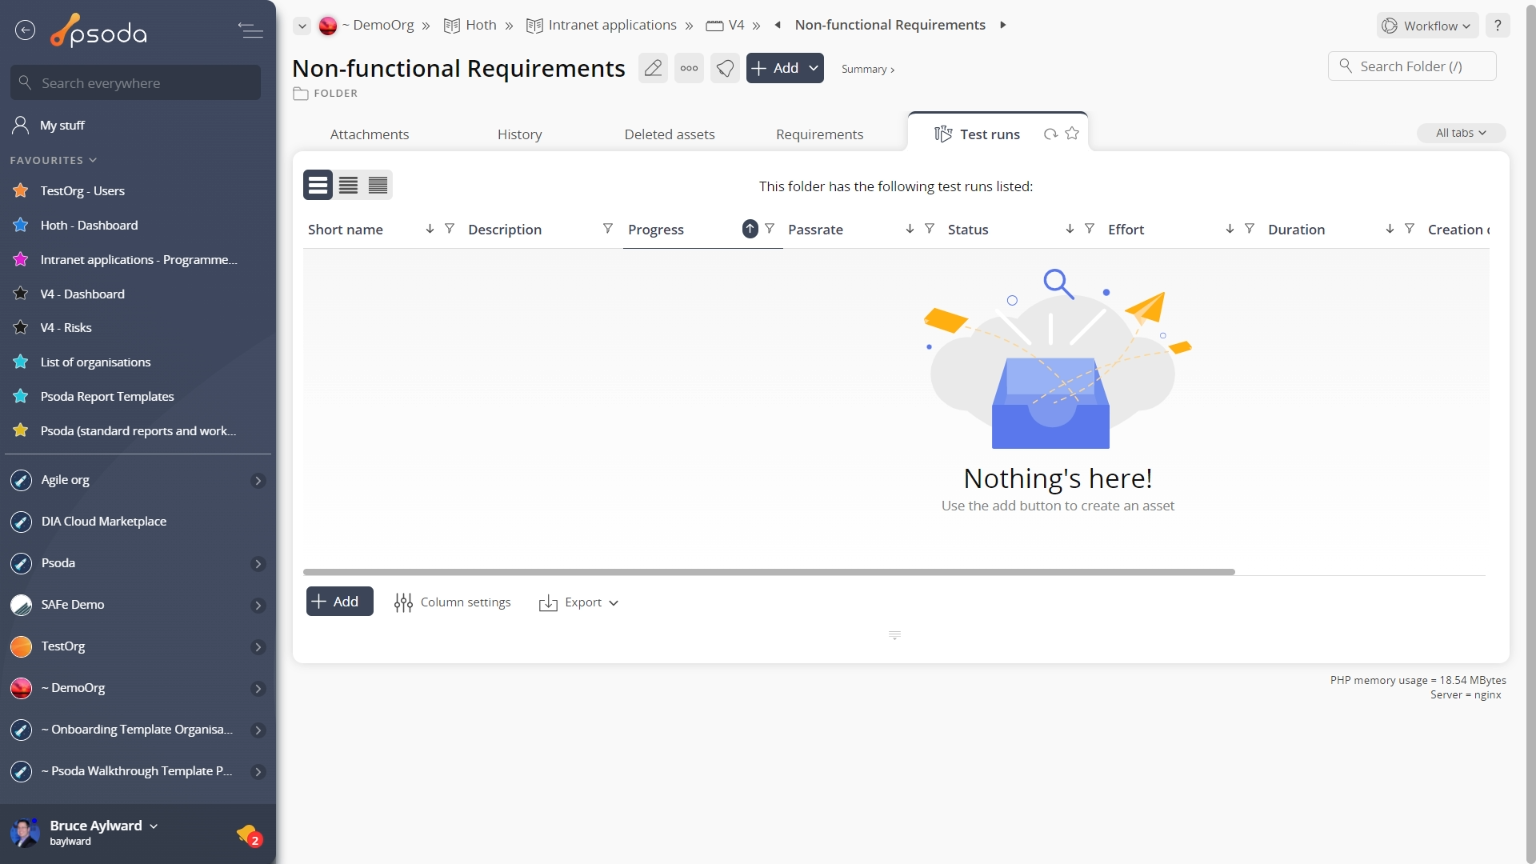
Figure 9 – Folder test runs tab
From the bottom of the table you can ![]() add more test runs and customise your table view by clicking the
add more test runs and customise your table view by clicking the ![]() edit button. From here you may also be able to export this list to
edit button. From here you may also be able to export this list to ![]() Excel or
Excel or ![]() CSV files.
CSV files.
 Traceability matrix
This tab shows the traceability matrix for this folder, as shown in Figure 10. The traceability matrix tool is used to visualise the relationships between requirements and requirements, requirements and test cases and other folder entities. It can also be used to add new relationships or to toggle the relationship flags.
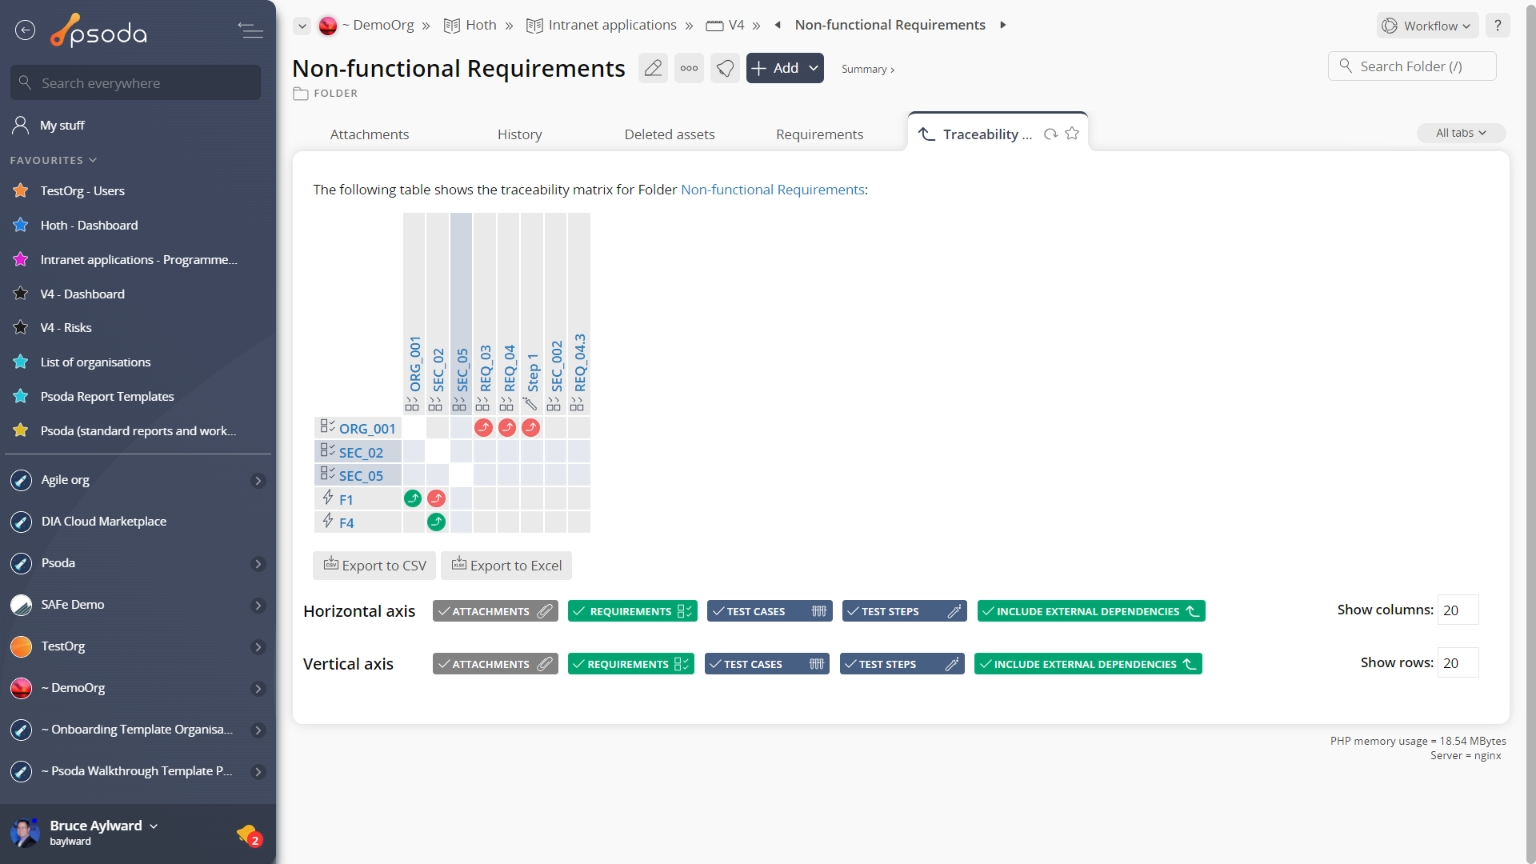
Figure 10 – Folder traceability matrix tab
Below the matrix itself, you can edit which assets you want to include on the horizontal and vertical axes by selecting or de-selecting the associated check boxes and selecting the Update matrix button.