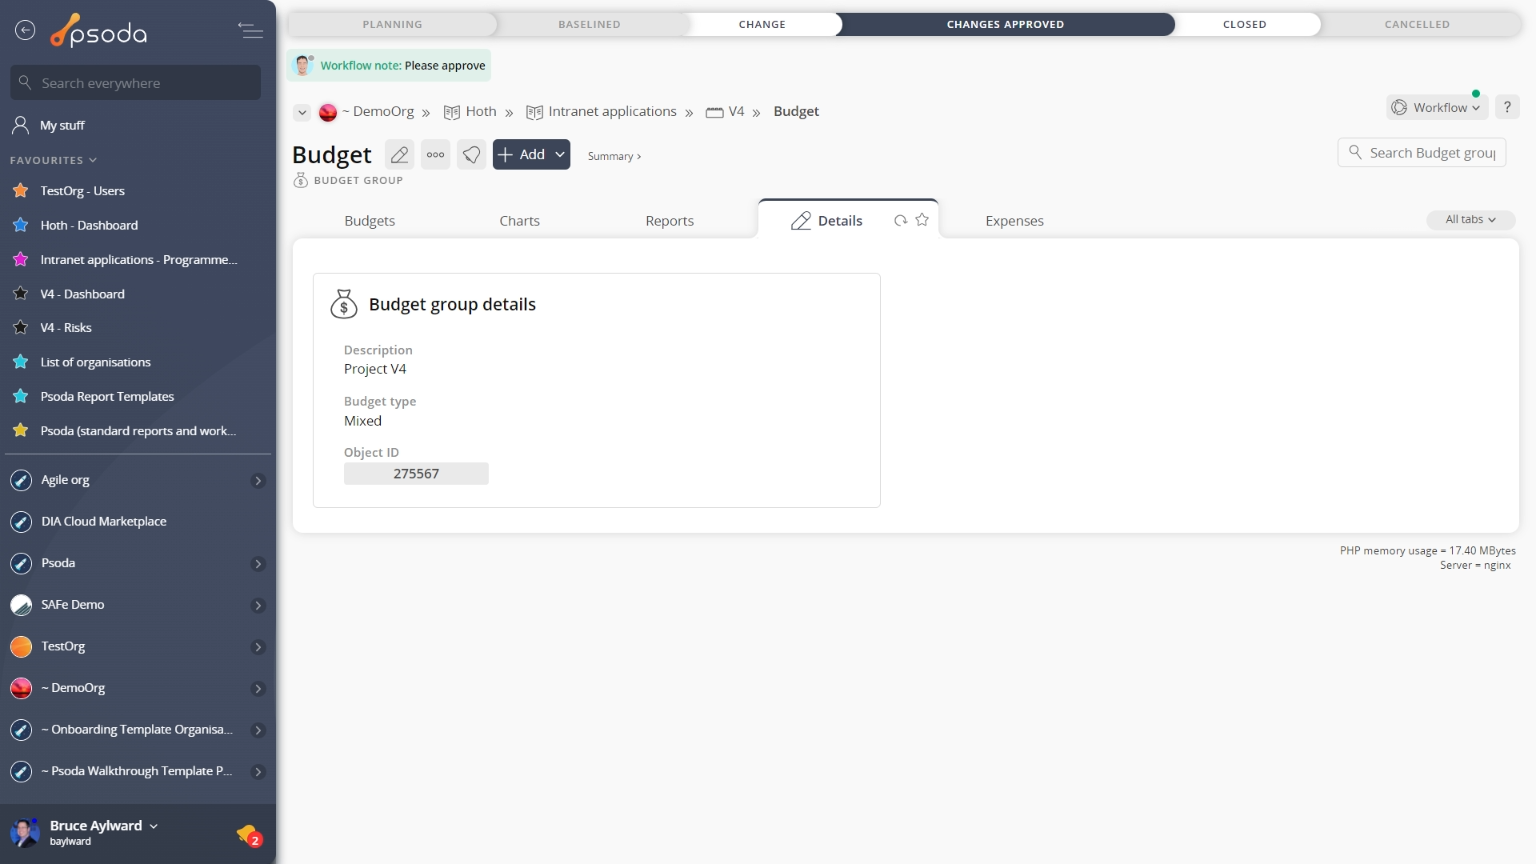
Figure 1 – Budget group view page
The top header area allows you to Attachments
This tab shows an asset listing of all of the attachments that have been added to this budget group, as shown in Figure 2. By default, this table will present you with a number of details about the attachments such as the file’s name, attachment type, view the version and access a download link.
From the Actions column of this attachments table, you can act on individual attachments by 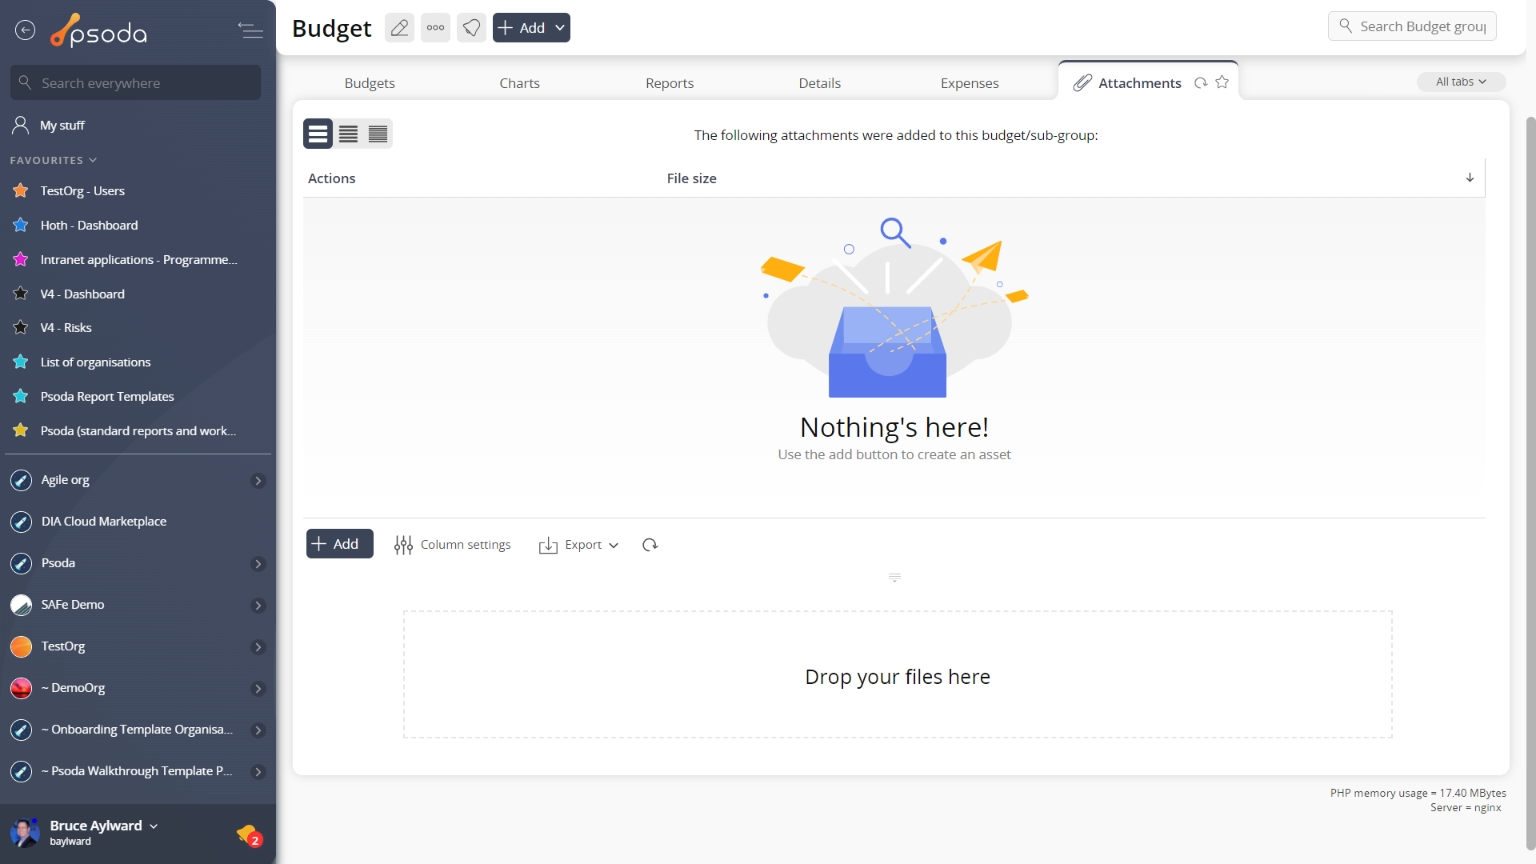
Figure 2 – Budget group attachments tab
Note that you can customise your table view by clicking the Budget
This tab shows an asset listing of all of the budget sub-groups or budget items that have been added to this budget group, as shown in Figure 3. By default, this table shows the baseline and actual cost details for this budget or sub-group, together with all of the budget items and sub-groups it contains.
From the Actions column of this attachments table, you can act on individual budget groups by 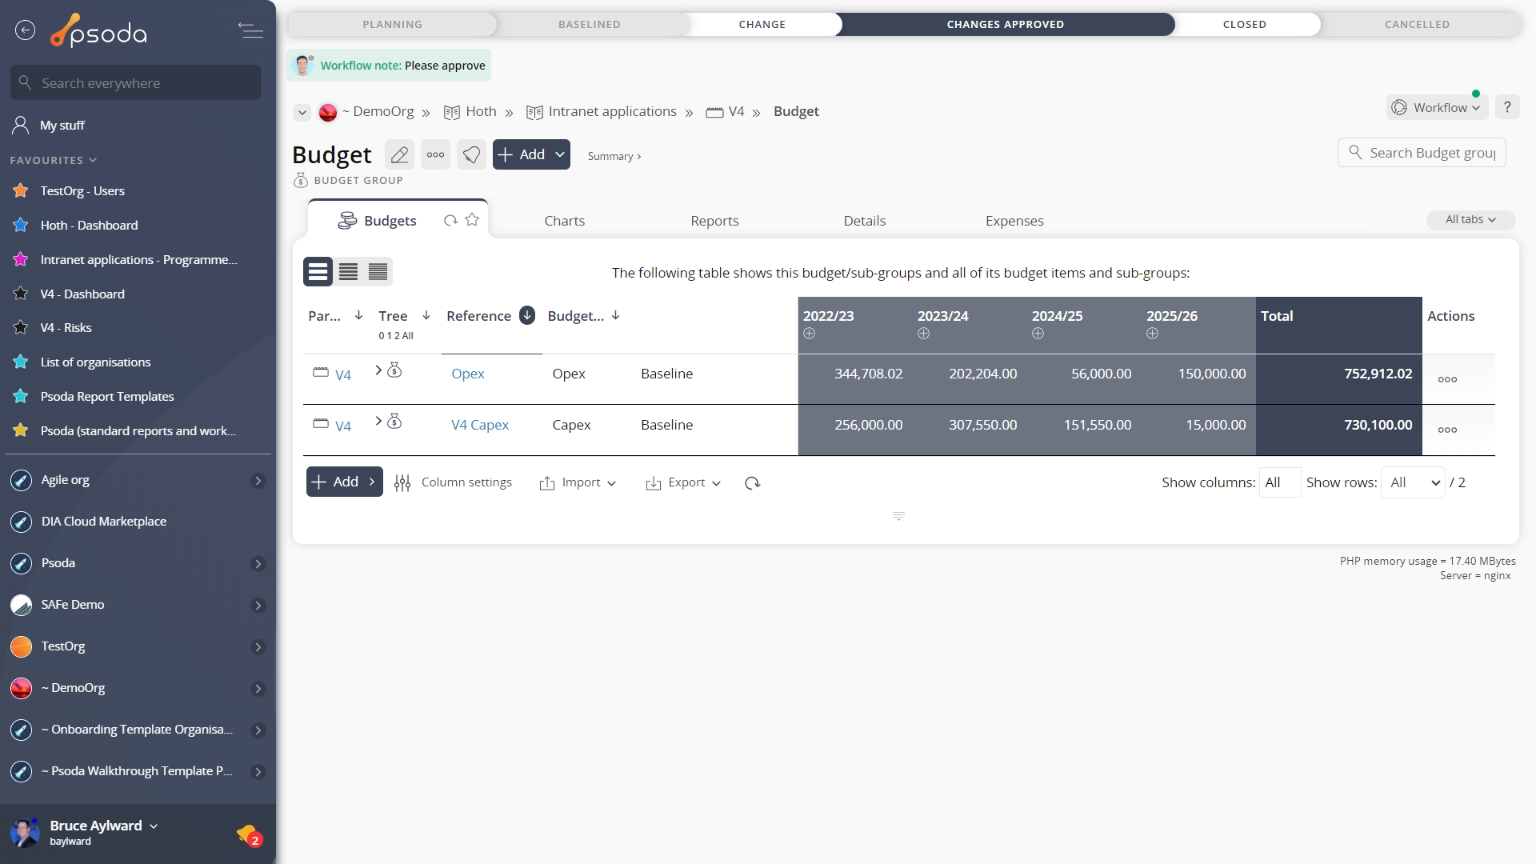
Figure 3 – Budget group budgets tab
Note that you can customise your table view by clicking the ![]() edit button at the bottom of the budget table or navigate to this same spot to
edit button at the bottom of the budget table or navigate to this same spot to ![]() add more budgets to this budget group, or
add more budgets to this budget group, or ![]() import a number of budgets from a CSV file. Here, you can also export this attachment list to
import a number of budgets from a CSV file. Here, you can also export this attachment list to ![]() Excel or
Excel or ![]() CSV files.
CSV files.
 Charts
Instead of a table view, this tab provides a graphical view of your accumulated baseline vs. actual over time for this budget group. The chart is generated from the information you put in the budgets table. Figure 4 below shows an example chart: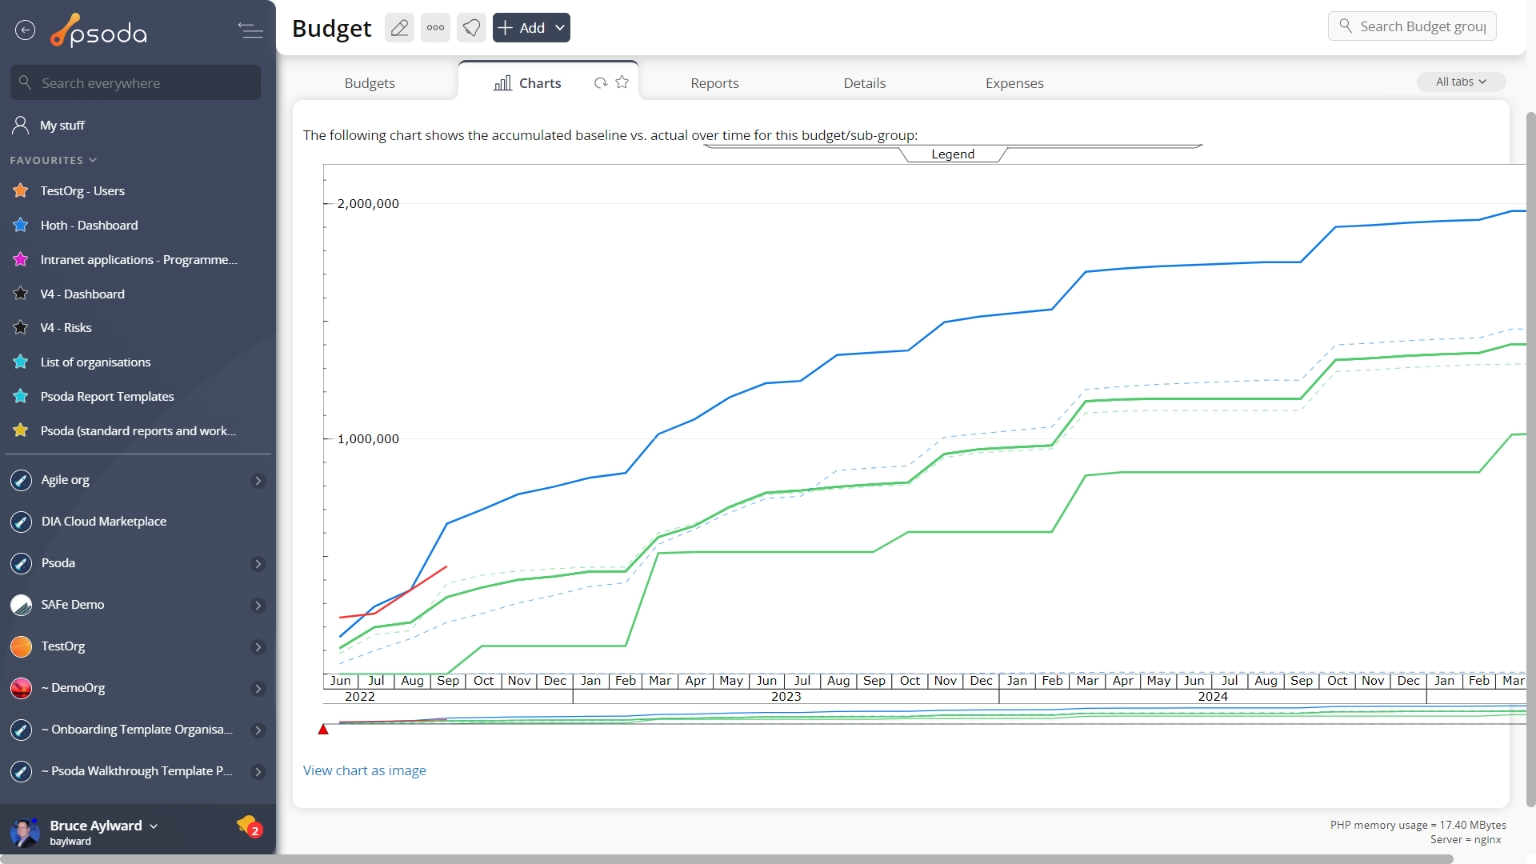
Figure 4 – Budget group chart tab
Zoom in or out on certain times by using the red arrows at the bottom of the chart. Comments
This tab shows an asset listing of all of the comments that 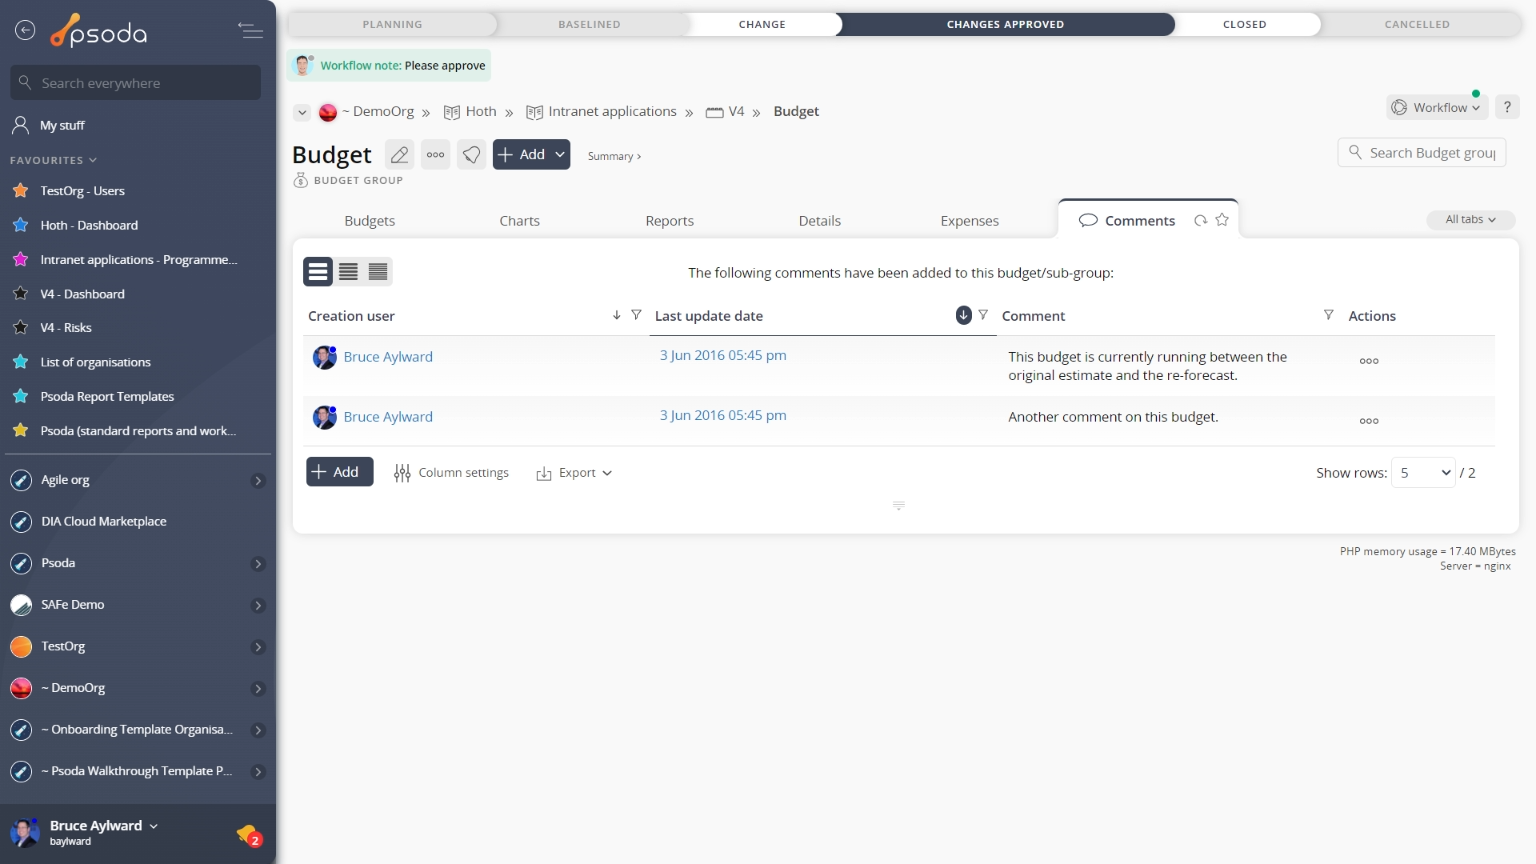
Figure 5 – Budget group comments tab
Note that you can customise your table view by clicking the Expenses
This tab an asset listing of all of the expenses logged for this budget group, as shown in Figure 6. By default, this table shows the budget item that this expense item is associated with, the reference, description, date, date of payment as well amount including and excluding tax information. The number of comments and attachments added to an expense item is also indicated in this view.
The Actions column of the expenses table provides accessible functions to act on a chosen expense item. These functions include  Figure 6 – Budget group expenses tab
Note that you can customise your table view by clicking the ![]() edit button at the bottom of the expenses table or navigate to this same spot to
edit button at the bottom of the expenses table or navigate to this same spot to ![]() add more expense items to this budget group. Here, you can also export this list to
add more expense items to this budget group. Here, you can also export this list to ![]() Excel or
Excel or ![]() CSV files.
CSV files.
 History
This tab shows shows some basic history of the budget group, as shown in Figure 7. By default, this tab will present you with a number of details about the budget group’s history such as the creation date, creation user, last update date and last update user. If the budget group has been changed then this section will also show a table of all the changes that has been made, including the date of each change, the field changed, the value before the change and the user who made the change.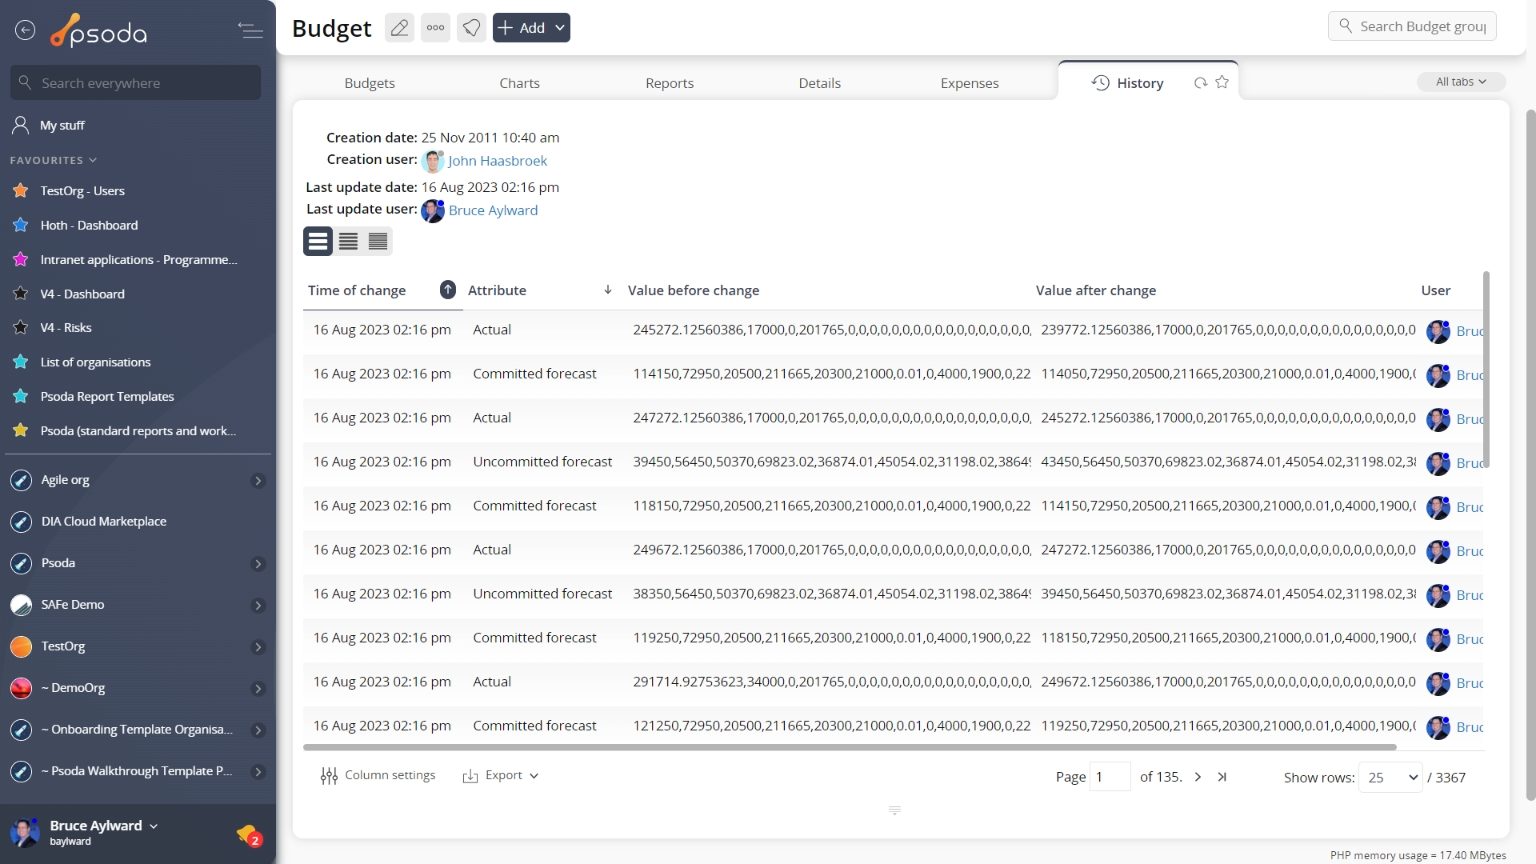
Figure 7 – Budget group history tab
Note that you can customise your change table view by clicking the ![]() edit button at the bottom of the change table. Here, you can also export this list of changes to
edit button at the bottom of the change table. Here, you can also export this list of changes to ![]() Excel or
Excel or ![]() CSV files.
CSV files.
 Reports

Figure 8 – Budget group reports tab
This tab shows a list of reports that you can run for this budget group, as shown in Figure 8. Workflow timeline
This tab shows you a table containing each of the state transitions that have been applied to this budget group on the associated workflow. Note that you can customise your table view by clicking the 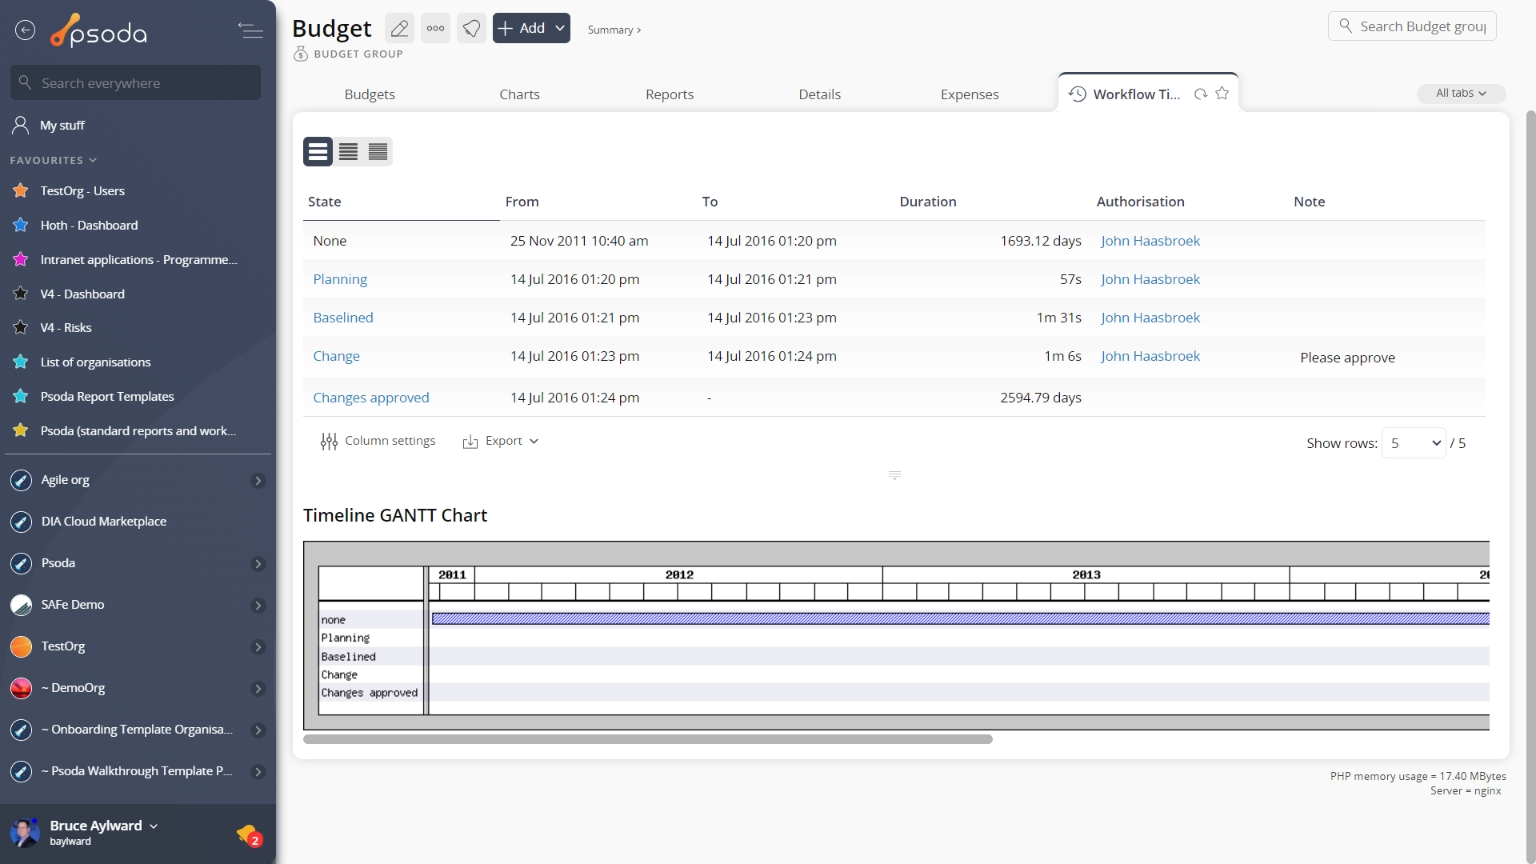 Figure 9 – Project workflow timeline tab
Below the state transition timeline table, you will be presented with a visual breakdown of the timeline in a GANTT chart, as shown in Figure 9.